Learn the ropes building your own functions in R using water data examples.
Official websites use .gov
A .gov website belongs to an official government organization in the
United States.
Secure .gov websites use HTTPS
A lock (
) or https:// means you’ve safely connected to the .gov website. Share
sensitive information only on official, secure websites.
Learn the ropes building your own functions in R using water data examples.
Submit to the river chlorophyll forecasting challenge, co-hosted by the USGS Water Mission Area and Ecological Forecasting Initiative.
The GDP web interface, processing service, and THREDDS data server are being retired.
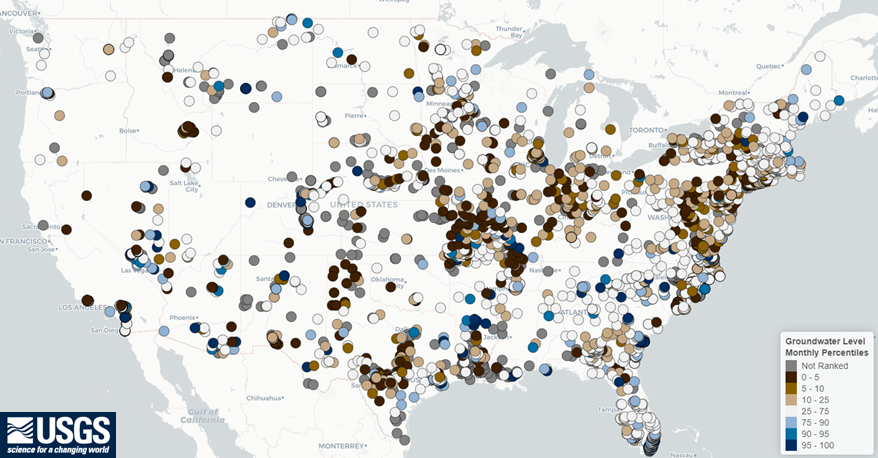
A new, experimental application for viewing groundwater levels with historical context and for generating site-level reports.
USGS is improving the way that sample data are stored and served to the public. These changes will affect our back-end data management systems, web services, application programming interfaces (APIs), computational tools, and user interfaces for accessing data.
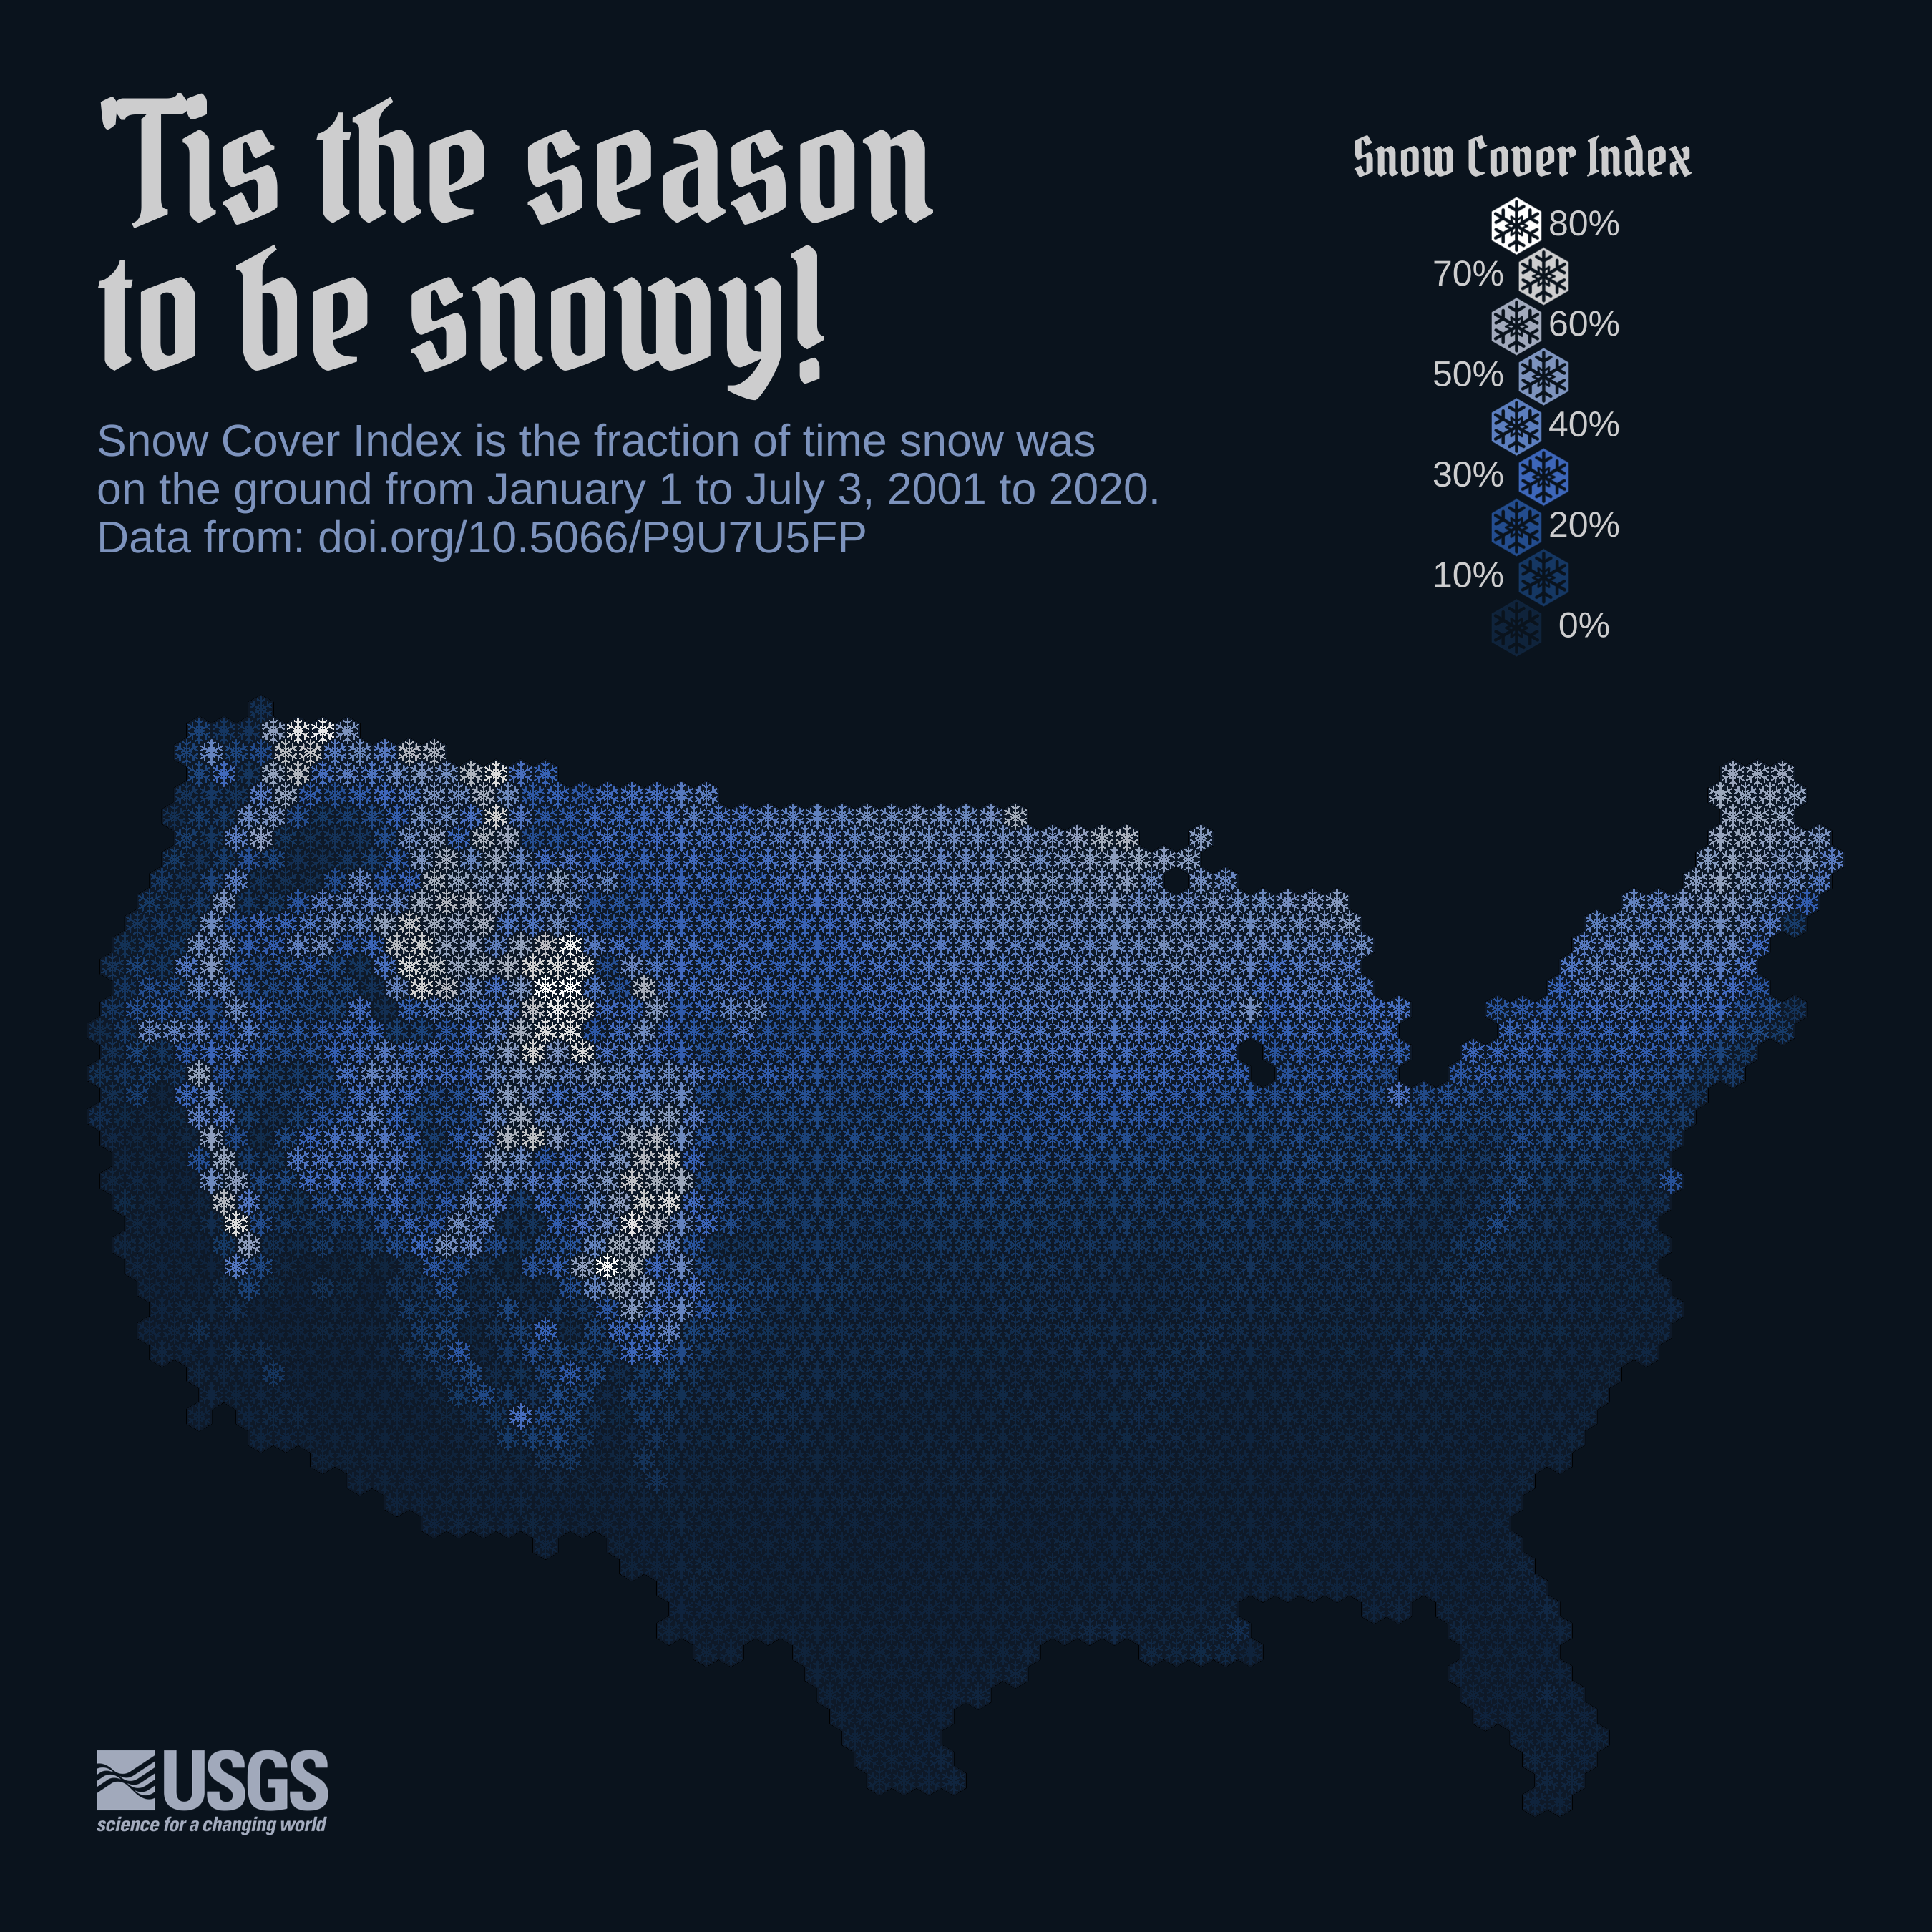
Reproducible code demonstrating the evolution of a recent data viz of snow cover in the lower 48 United States
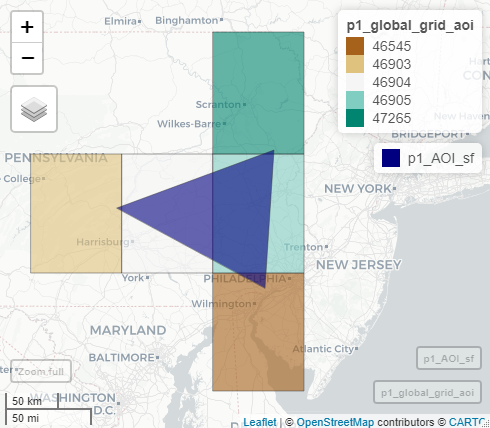
A pipeline-based approach for making large data pulls from Water Quality Portal