
Category: Data Visualization
Reproducible code demonstrating the evolution of a recent data viz of snow cover in the lower 48 United States
On October 13th 2022, we released a new water cycle diagram! This update re-envisions the water cycle, placing human activities at the forefront. We designed it to emphasize scientific accuracy, information design, and usability in educational settings. We hope that students of all ages better understand how humans affect where water is on Earth and how it moves, so that we can work towards using water more sustainably.
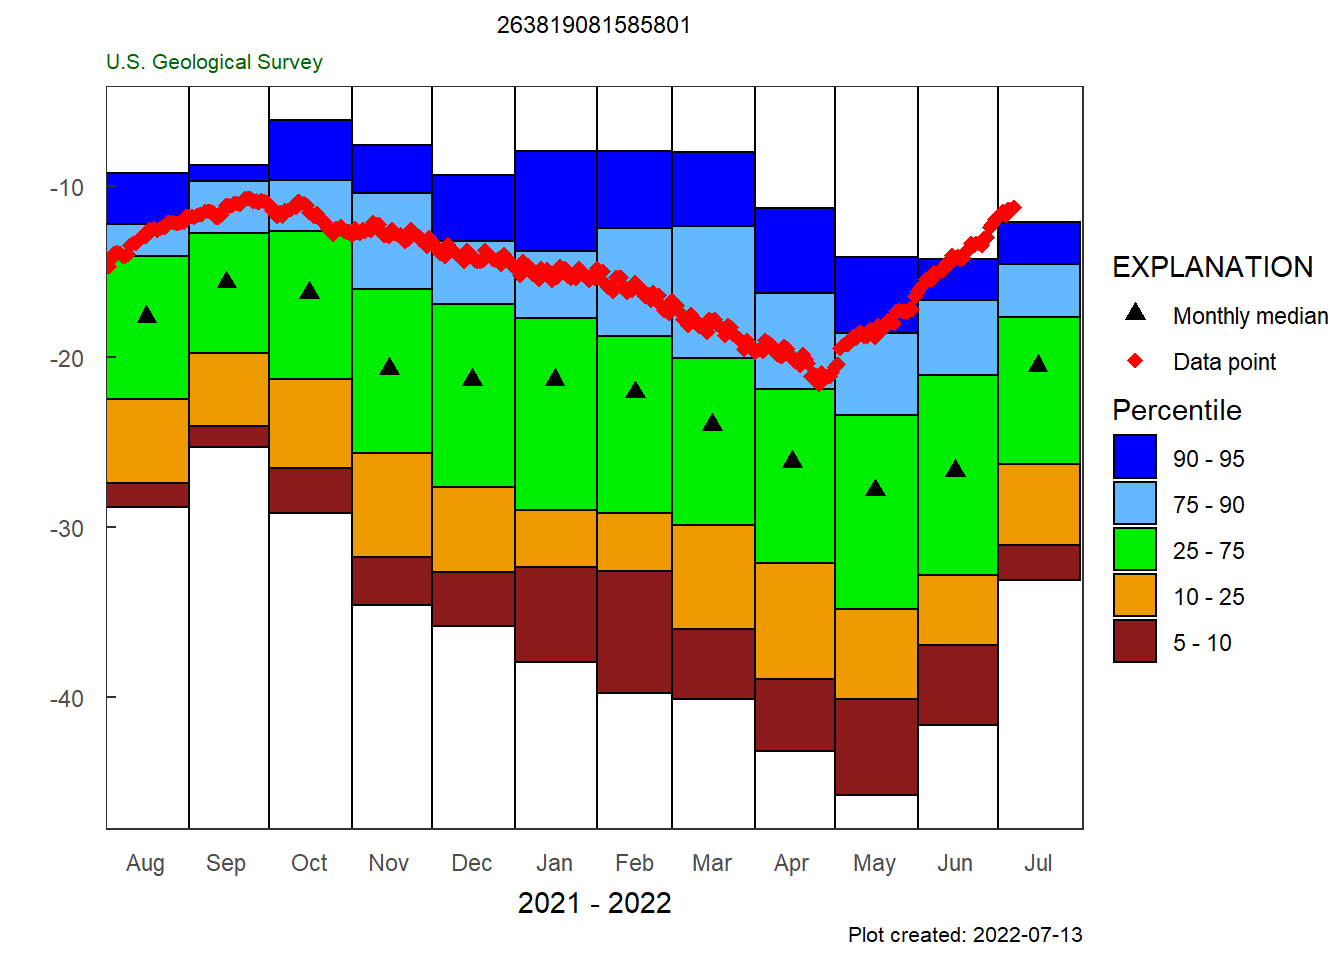
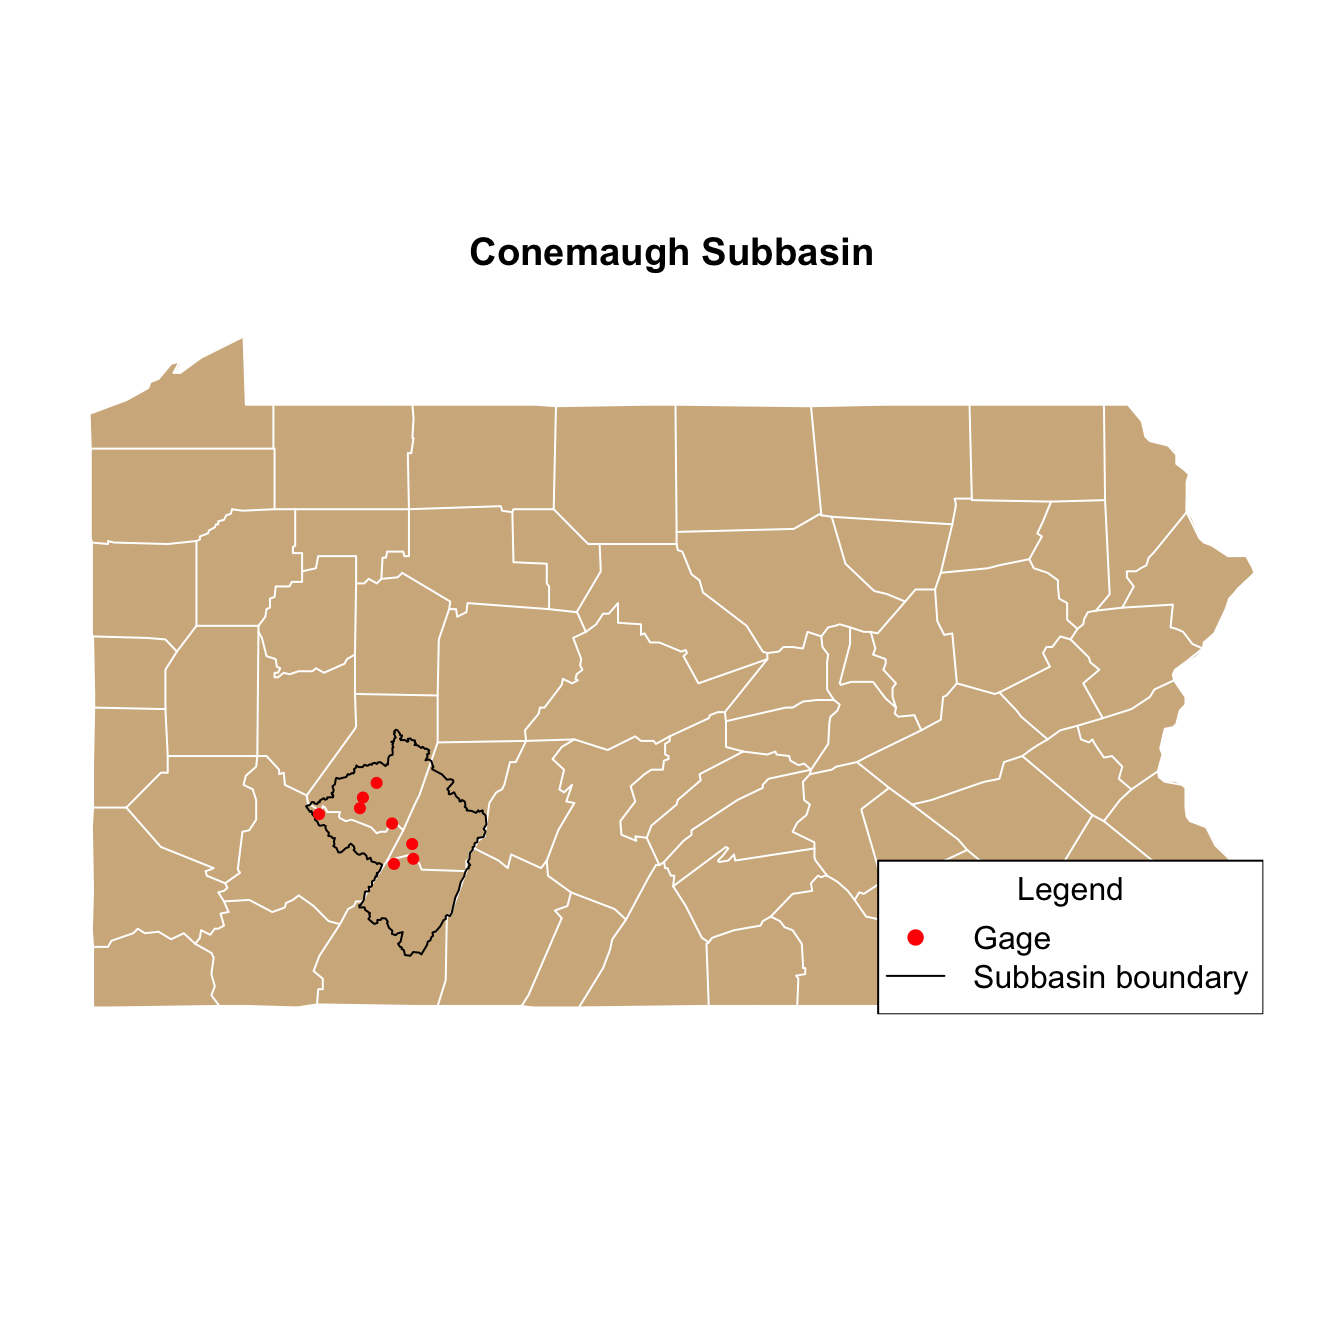
Introduction to HASP package for groundwater data.
Use R to generate a video and gif similar to the Vizlab animation series, U.S. River Conditions.
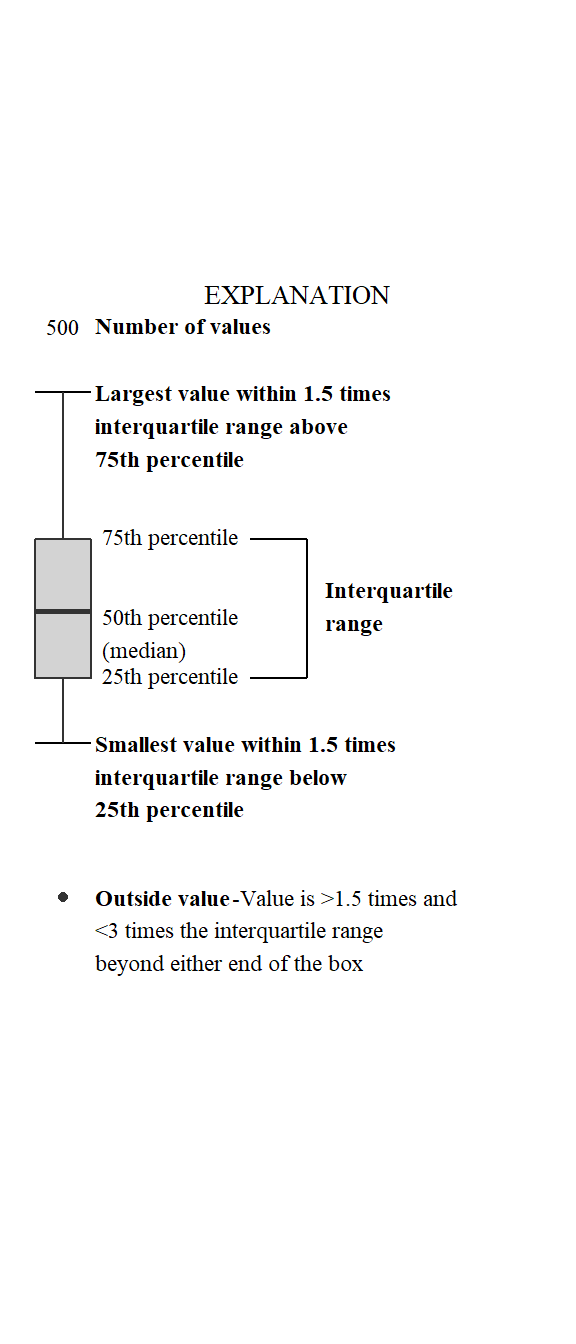
Identifying boxplot limits and styles in ggplot2.