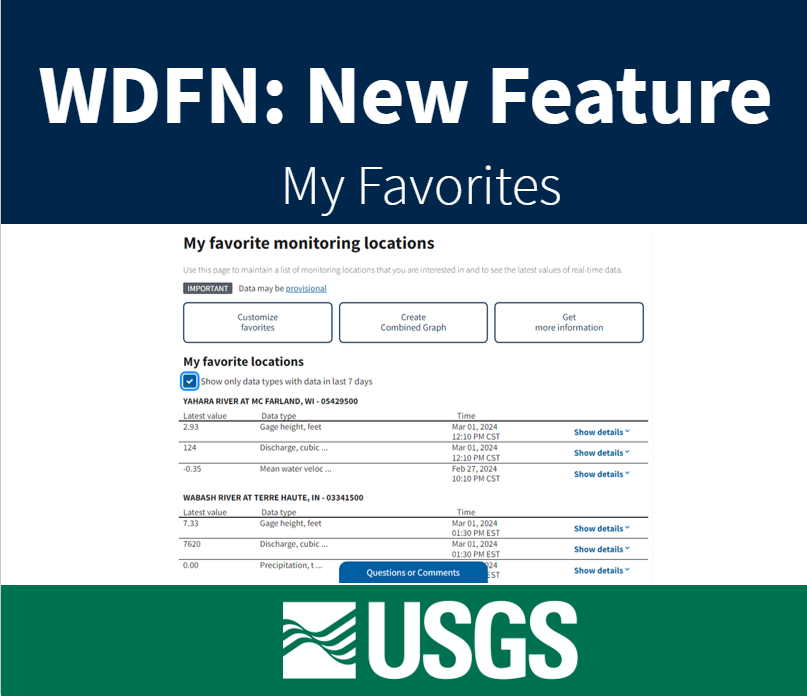
Feature to maintain a list of monitoring locations you are interested in and to see the latest values of real-time data.
Official websites use .gov
A .gov website belongs to an official government organization in the
United States.
Secure .gov websites use HTTPS
A lock (
) or https:// means you’ve safely connected to the .gov website. Share
sensitive information only on official, secure websites.
Feature to maintain a list of monitoring locations you are interested in and to see the latest values of real-time data.

The USGS is expanding its implementation of the Water Quality Exchange (WQX) standard for delivering water quality and sample data.
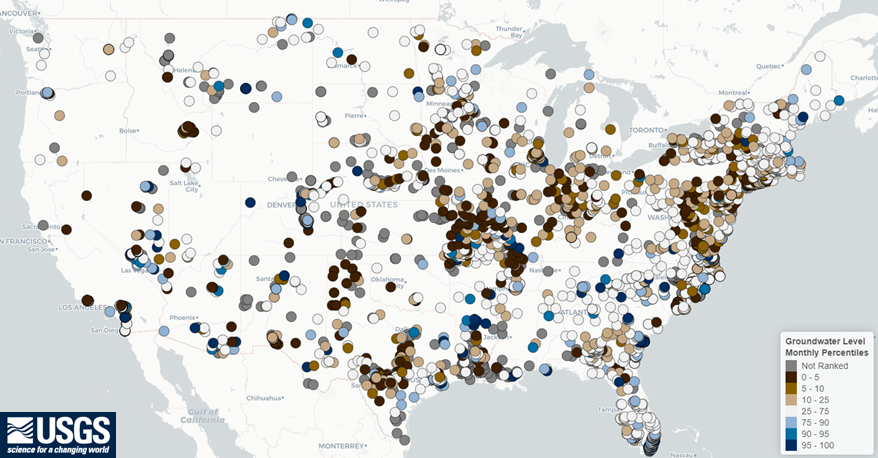
A new, experimental application for viewing groundwater levels with historical context and for generating site-level reports.
USGS is improving the way that sample data are stored and served to the public. These changes will affect our back-end data management systems, web services, application programming interfaces (APIs), computational tools, and user interfaces for accessing data.
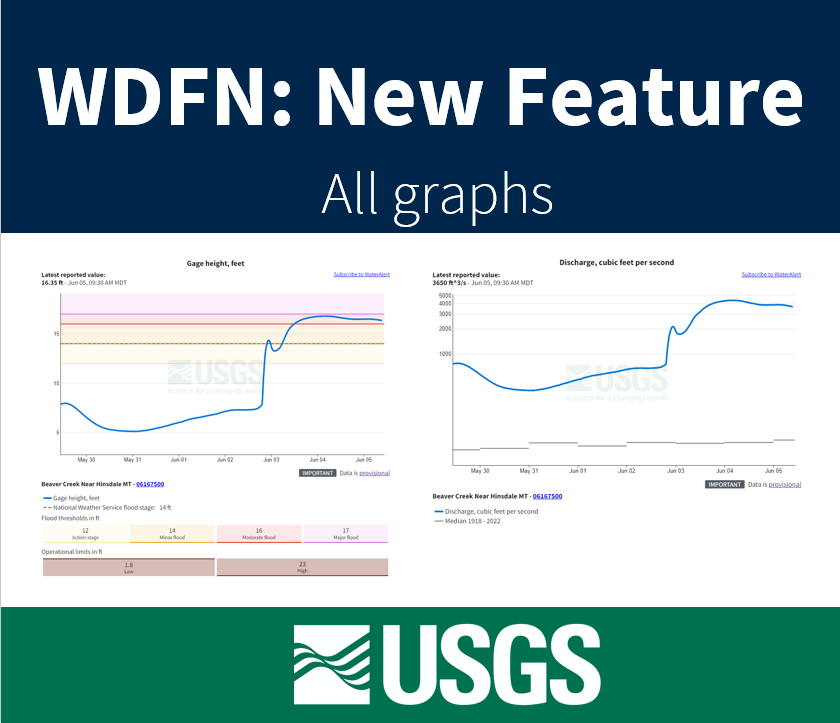
Feature to see a series of graphs of all current sensor data collected at a single location is available now.
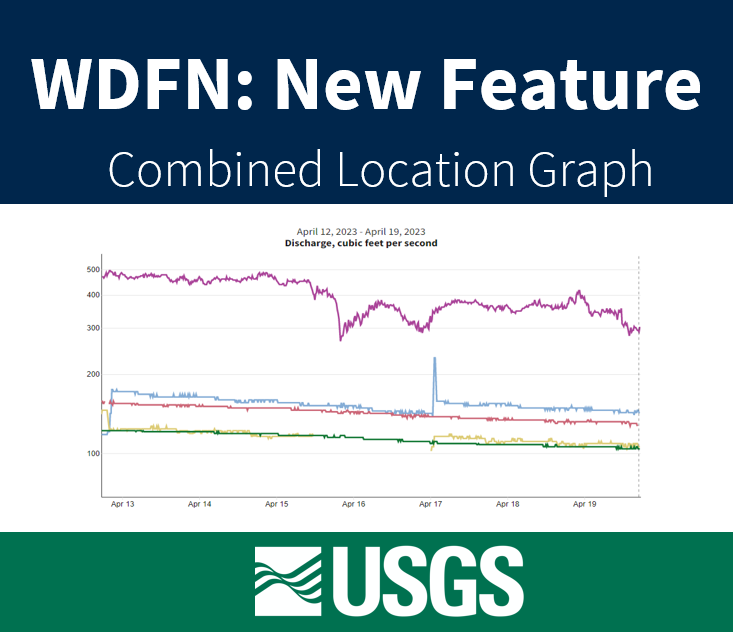
Graphing data for 5 locations on a single graph now available on WDFN
A look into the current and coming soon features available in WDFN. Updated in 2025 to highlight progress and include links to new features
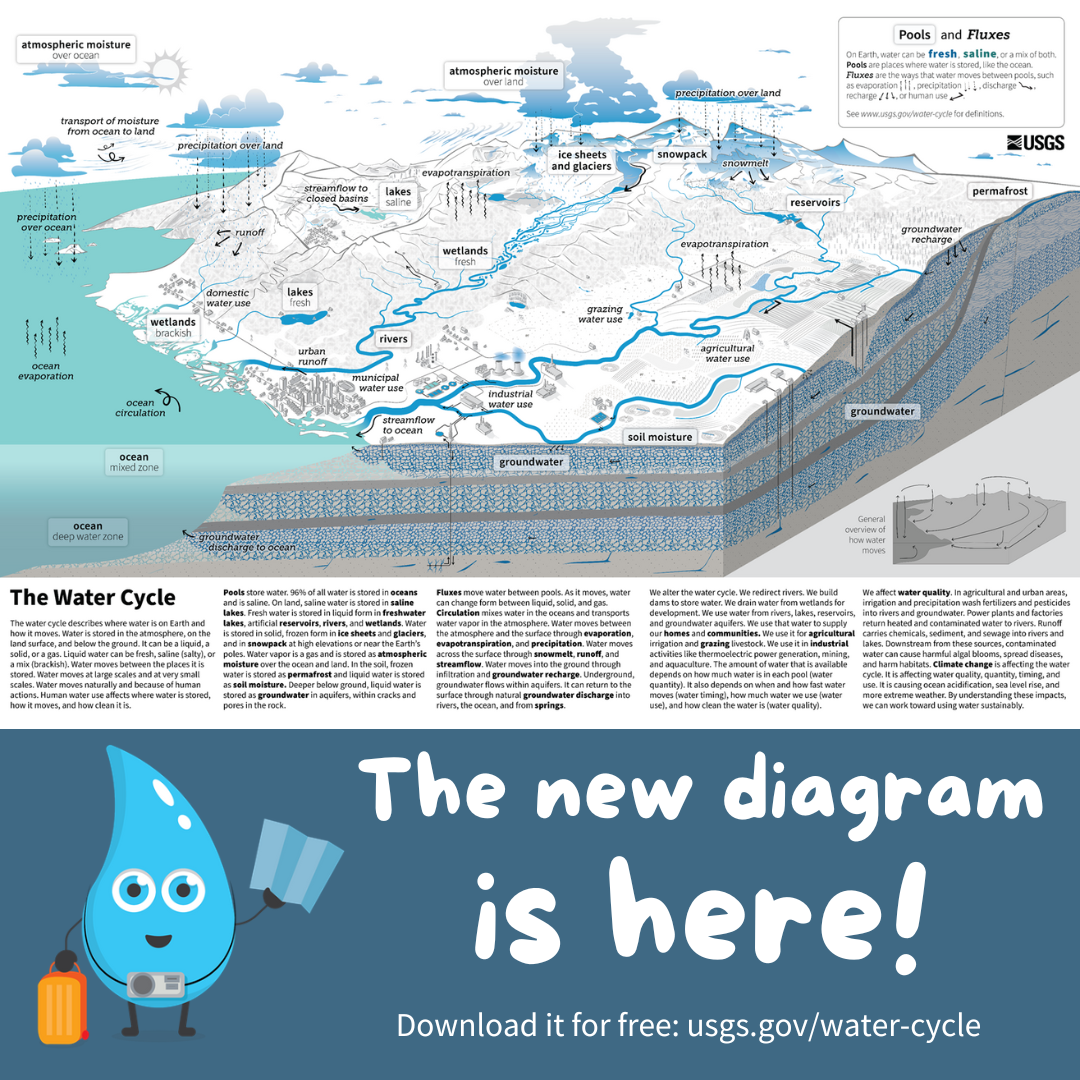
On October 13th 2022, we released a new water cycle diagram! This update re-envisions the water cycle, placing human activities at the forefront. We designed it to emphasize scientific accuracy, information design, and usability in educational settings. We hope that students of all ages better understand how humans affect where water is on Earth and how it moves, so that we can work towards using water more sustainably.
A pipeline-based approach for making large data pulls from Water Quality Portal