
Why we use gage height
Gage height is used as a default parameter for water availability at streamgages for better user context.
Making Water Data Easier to Understand
On USGS water monitoring location pages, the default parameter that is displayed for streamgage sites is gage height. Other measures like streamflow are still available and easily accessed with just one click. Gage height is the distance (or height) of the water surface above the streamgage datum reference point. Gage datum is a unique reference point to each gage site and is generally located underneath the streambed to accommodate for stream channel changes.
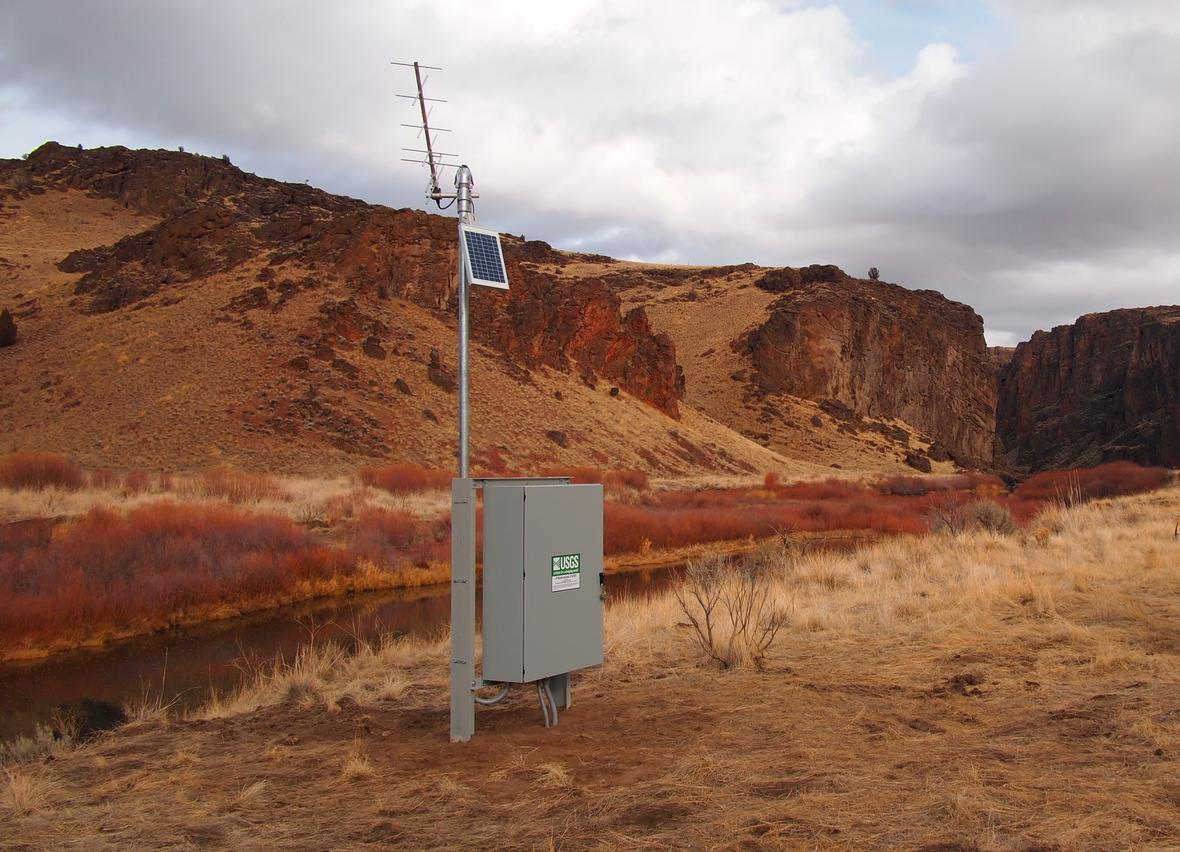
Streamgage 13176400, East Fork Owyhee River at Crutcher Crossing, ID, provides critical data that the U.S. Bureau of Land Management needs to secure water rights to protect the Owyhee Canyonlands wilderness area.
Gage Height to Describe Water Quantity
Based on user feedback, we updated our streamgage monitoring location pages so gage height is the first parameter users see on hydrographs.
Users often understand what water height measurements mean to them; they know how gage height relates to benchmarks and landmarks in their area. Additional measures of water quantity, such as discharge are still available on the monitoring location pages. Discharge, which is sometimes called streamflow or water flow, is defined as the rate at which a volume of water passes by a particular location.
Discharge and gage height are related values. Although discharge values often make news headlines, many users have told us that gage height values are the most useful to them when making decisions (such as for recreational or emergency purposes). As a result of this feedback, we now show gage height as the default display on streamgage monitoring location pages.
Discharge (streamflow) for the same time period as the graph on the right at monitoring location 07074420
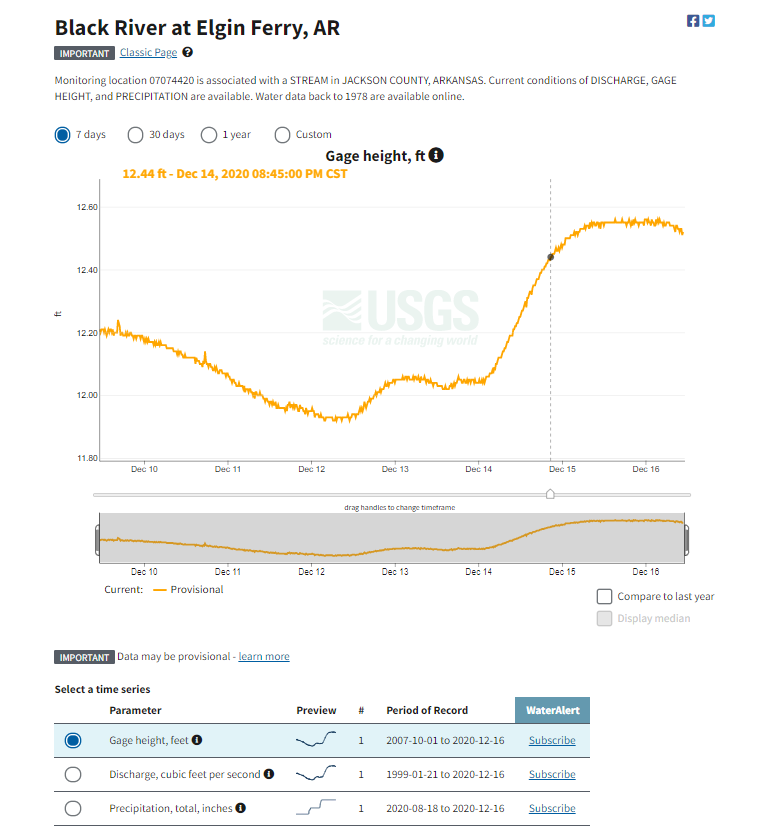
, Black River at Elgin Ferry, AR Gage height for the same time period as the graph on the right at monitoring location 07074420
, Black River at Elgin Ferry, AR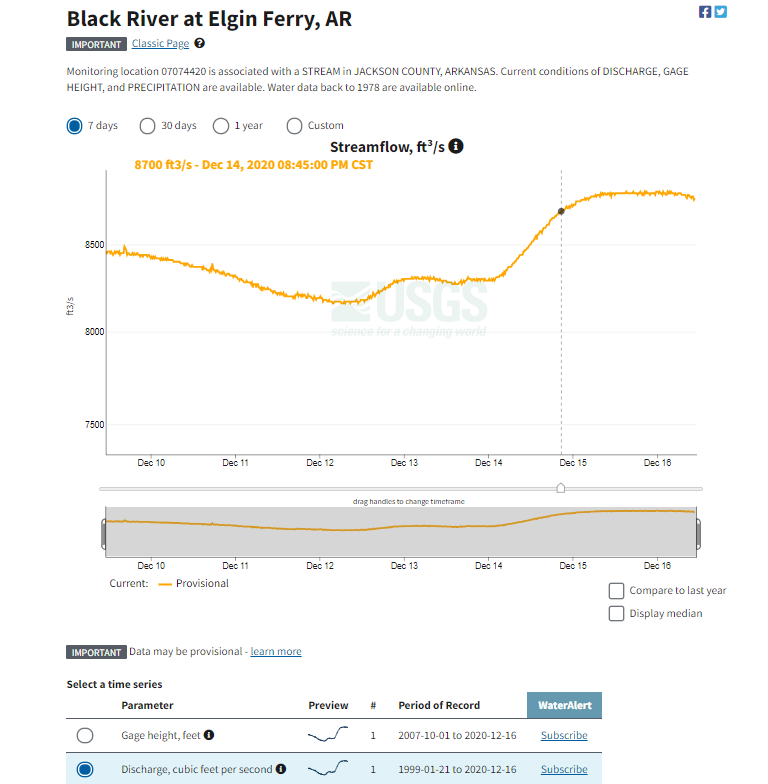
What Exactly is Gage Height?
Gage height is the distance (or height) of the stream (or lake) water surface above the gage datum (reference point). Read about the history of stream gages in this interactive post . The gage datum is a uniquely selected reference point for each gage site. Most of the time, it is picked to be below the lowest anticipated depth of a stream or lake because streambeds change over time. At some locations, particularly those near the ocean, this arbitrary reference point may be picked to be at sea level.
Gage Height is Also Called...
Stage
River Height
River Level
Stream Height
Stream Stage
Water Height
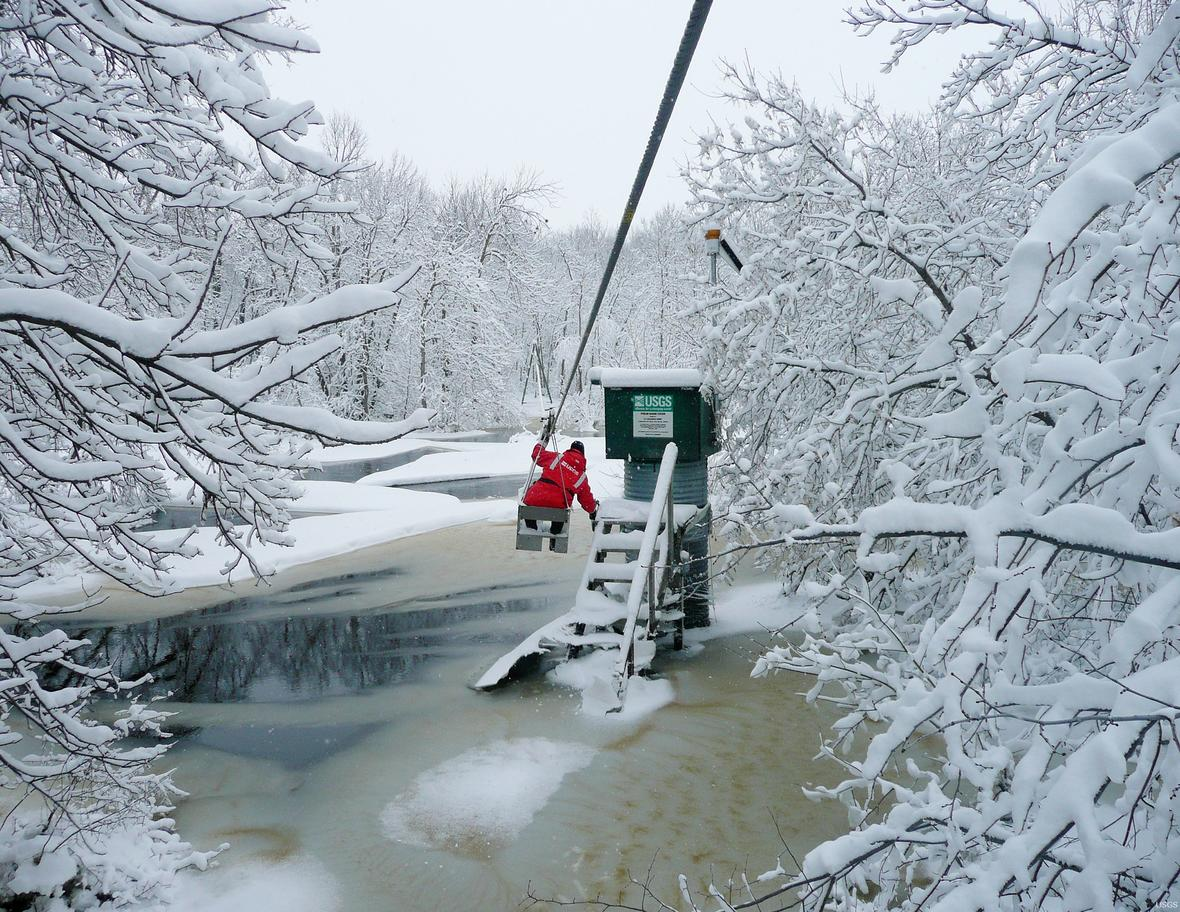
USGS employee, Russ Buesing uses a cable car to access a gage (05104500) in winter on the Roseau River near Malun, MN.
Why Doesn’t USGS Measure Gage Height From the Bottom of the Stream?
Gage Datum – The Reference Point
Streams are like living things and are constantly changing. Sometimes streams erode, becoming deeper while other times streams deposit sediment, becoming shallower. To understand how those changes can affect streamflow, we need to measure from a reference point that does not change over time, which is why gage datums are chosen to be below the base of a streambed.
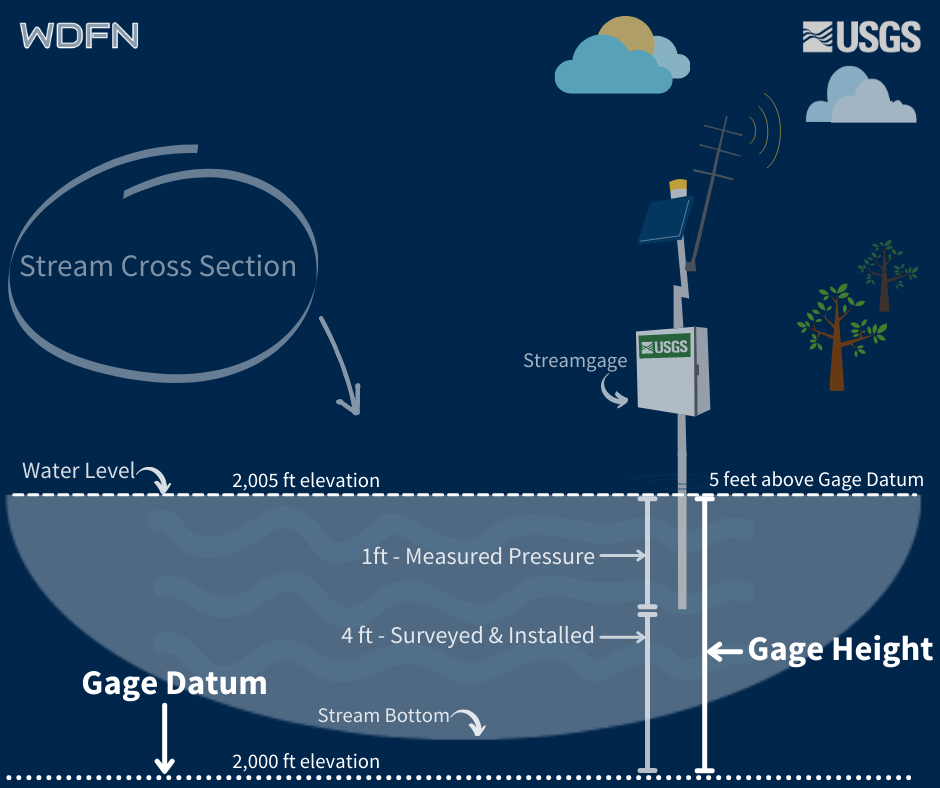
Gage height and gage datum graphic. Gage height is the measurement from the water surface down to the gage datum.
Complex Math to Estimate Discharge
Complex math is used to compute the relation between gage height and discharge. It is easier to continuously measure the height of water than a volume of water passing by a point, so gage height is the parameter that is reported continuously and is used to compute the related discharge . Another reason that gage datums are picked to be below streambeds is related to the mathematical computations that relate gage height to discharge.
Why Gage Height Matters
Faster Insights Into Flooding
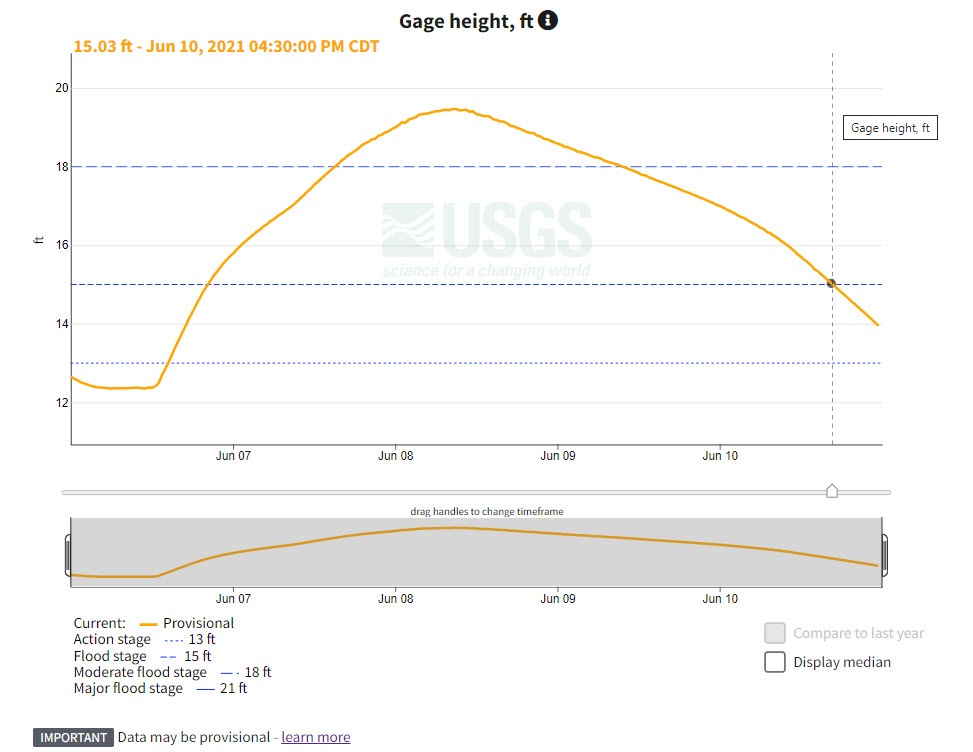
Gage height is used in computer models and forecasts, including flood inundation maps and flood forecasts. Flood stage , officially defined by the National Weather Service , can be thought of as the stage (or gage height) at which overflow of the natural banks of a stream begins to cause damage in the local area from flooding. The National Weather Service uses gage height numbers to tell the public about different levels of flooding hazard. Therefore, gage height values are commonly understood by water managers, emergency responders, and public citizens.
Where National Weather Service flood stages are available for USGS sites, we overlay those flood stages as horizontal lines on our gage height hydrograph, allowing users to instantly see how close the gage height is compared to known National Weather Service flood stages near the location of the gage. Where data are available, users can also use the Flood Inundation Mapper tool or the Interagency Flood Risk Managemen t tool to visualize what flooding will look like at different gage heights.
A hydrograph of the Tangipahoa River at Robert,LA with Flood Stages visible.
Real-time Response to Changing Gage Heights (Stream or Lake Levels)
Users can receive personal WaterAlerts if a gage height exceeds a threshold of their choosing. Users can choose to use a gage height they are familiar with for their alert so they can respond quickly to changing water conditions. For example, a rancher may choose to be notified when the stream by their property exceeds a nearby gage height of 5.2 feet, so that they know it may be time to move their livestock farther from the river. A homeowner may choose to be notified when a gage height exceeds a certain value to be alerted that a nearby road may become flooded. An emergency responder may wish to receive alerts to know when to take particular actions such as closing a roadway. A farmer may want to know when a stream water level drops below a certain level as it may affect an irrigation intake pump.
Categories:
Related Posts
Modernizing How You Access Water Data | Webinar on Oct 13 | Recording Available
October 1, 2021
Missed the webinar? Watch the recording
The recording of this webinar can be viewed on the USGS website or on the USGS YouTube channel .
How Web Flags help the public understand our data
June 20, 2021
How Web Flags help the public understand our data
USGS Water Data are important to the public and help people to make critical decisions, but conditions in the field are often complicated to convey. Therefore, USGS hydrologic technicians apply web flags to convey gaps in data to the public so users understand unusual values or missing data.
How we work on the Water Data for the Nation Team
March 9, 2021
The USGS Water Mission Area (WMA) is the largest provider of real time and historical water information in the world. A major part of our work in the WMA Web Communications Branch is to build modern web applications and APIs to make these data publicly available. We call our data delivery product line Water Data for the Nation (WDFN). Here’s our product vision:
Additional field measurements are coming to WDFN
June 25, 2026
Water Data for the Nation (WDFN) publishes multiple categories of data collected at our monitoring locations, including both data collected by automated sensors and through manual methods. Manually collected data, which we refer to as “field measurements,” are collected during visits to a monitoring location.
New Feature - Expiration of alerts on WaterAlert
May 20, 2026
Since the modernized version of WaterAlert was launched in 2022 , it has grown to help over 60,000 users stay informed about changing water conditions at their selected monitoring locations. Automatic alerts by email or text inform users when conditions meet threshold values they have set, and in 2025 the WaterAlert system sent over 13.5 million alerts with spikes of over 350,000 per week during critical events and emergencies in the spring and summer.