
Changes to Particular Groundwater-Level Observations
This posts explains the way we changed groundwater-level observations to the pre-2021 way of publishing observations.
Groundwater-Level Observations Affected by Dry, Flowing, Frozen, Obstructed, and Pumping Conditions
In February 2021, USGS Water started serving groundwater-level data in a way that deviated from how we had in the past. Due to a change in our software, we began publishing some groundwater observations in a new way. This affected many of our products and our users. Our users had to change their workflows and they found the data presentation inaccurate. Products such as Groundwater Watch experienced shifts in statistics.
Based on feedback and a careful review, we have made changes to the way these observations are published so our data are clearly interpreted. The purpose of this blog post is to help explain the process we went through over about a year, resulting in essentially returning to the pre-2021 way of publishing groundwater-level observations affected by dry, flowing, frozen, obstructed, and pumping conditions.
Which observations were affected?
The groundwater observations most affected by our 2021 changes were those relatively rare ones where hydrographers attempt to make a measurement of the groundwater level in a well and cannot because the well is dry, water is flowing out of the top of the well, water is frozen inside the well, or an obstruction in the well prevents the instrument from reaching water. In these instances, it is important for users to know the site was visited, but the groundwater level could not be measured successfully.
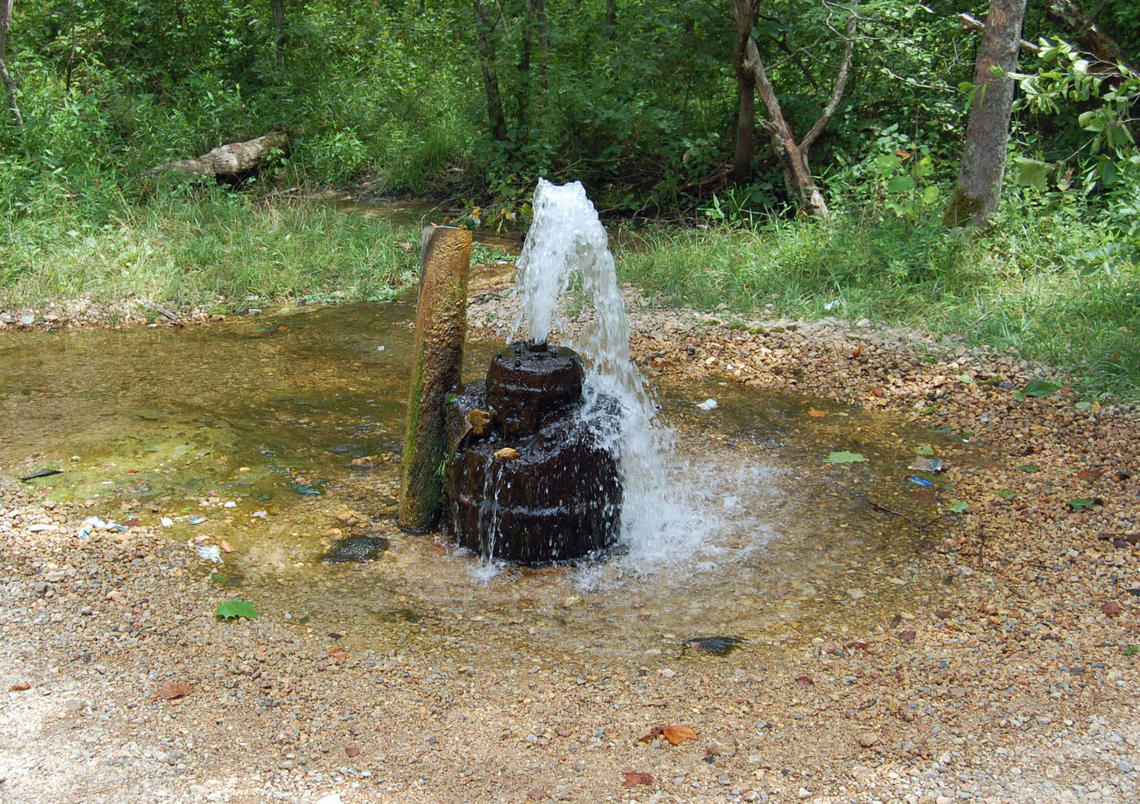
Figure 1. A flowing artesian well in Sycamore Valley, Missouri. A visit to this site may result in a qualifier of a flowing well.
Additional groundwater observations affected by our 2021 changes were groundwater-level measurements known to be affected by active pumping, either in or nearby the well that is being measured. In this instance, we make a successful measurement and obtain a publishable data value but must ensure people understand this observation does not reflect the static groundwater level.
How data were changed
As part of a major software transition that we completed in 2021, we changed how these affected observations were published in tables and on graphs on the Web. Before the transition, the observations had a descriptive qualifier (e.g. “dry” or “obstructed”), but no numeric data value. After the transition, the observations had a vague qualifier (“true value is below reported value due to local conditions” or “true value is above reported value due to local conditions”) and an estimated numeric data value derived from well construction, measuring point, or depth of blockage information. For example, an observation of a dry well was reported as the numeric value of the bottom of the well casing and qualified as “the true value is below this reported value.”
These numeric data values appeared on hydrographs on both legacy and next-generation monitoring location pages in way that confused users. Figure 2 shows an example of a well that was frequently dry. The unsuccessful measurements started appearing as if they had measured numeric data values; for example, observations of a dry well appeared as if they were actual observed groundwater-level measurements at the bottom of the well.
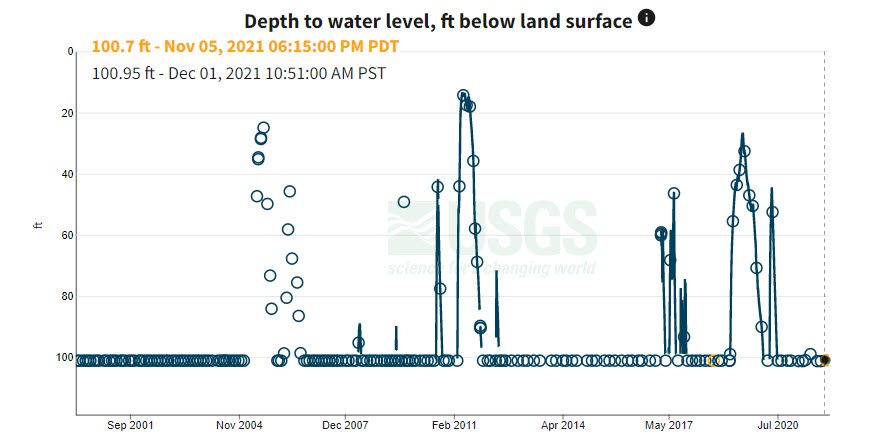
Figure 2. A hydrograph showing unsuccessful measurements as numeric values. The unsuccessful measurements that produce the flat line near the 100-ft level indicate the well was dry, and do not represent actual groundwater-level observations.
Users told us the change was confusing
After we changed how these unsuccessful measurements appeared, users told us they didn’t like this change. The change we made equated estimated data with measured data, which was a problem for users. Users felt confusion because we were assigning a numeric value when it shouldn’t have been there. In order to know the value was estimated, users would have had to consider the associated qualifier code.
Users said they didn’t understand the data as presented and were concerned about the validity of these data. We talked to groundwater users to understand how this was confusing, and how our data affect their workflows. Some users were confused by the wording of the qualifier code, while others stated that it would be challenging to defend these confusing data values in legal cases. We learned that the descriptive qualifiers indicating well conditions that were used prior to the transition are important to some of our users.
“I would say the vast majority of users are not going to understand that those (numeric values) are censored values and they’re just going to download them and roll them into whatever statistics they use.” -Groundwater-level data user
We recognize this affected our users in a much larger way than we had anticipated. We are committed to responding to our users’ needs and are grateful that our users pointed out their concerns and issues with this data delivery.
How we fixed this
To address user concerns, we changed our published groundwater levels back to a way that is more consistent with how we historically have served these data. Observations of dry, flowing, frozen, or obstructed wells are no longer reported as qualified numeric data values. Instead, they are reported with a clearly descriptive qualifier (dry, flowing, frozen, or obstructed), and there is no numeric data value reported. We still publish numeric data values at wells affected by pumping (as we have all along), but we are showing the descriptive qualifier “pumping” associated with these data values rather than the vague qualifier “true value is above reported value due to local conditions”—users must clearly understand when active pumping affects our observations.
The data display now reflects that a field visit was made to a site along with any qualifiers needed to indicate conditions at the time of observation that either prevented a measurement or may have affected the measurement and numeric data value obtained. These changes are now apparent in tables and in hydrographs. These changes are reflected throughout our system, and now statistics and long-term trends have been amended to contain these data.
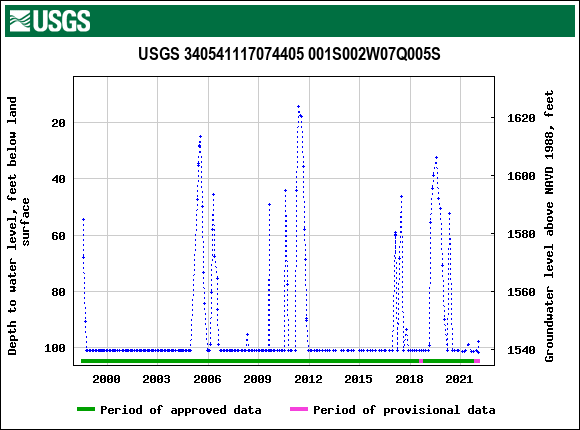
Figure 3. A hydrograph on the legacy system showing unsuccessful measurements as numeric values. the unsuccessful measurements that produce the flat line near the 100-ft level indicate the well was dry, and do not represent actual groundwater-level observations.
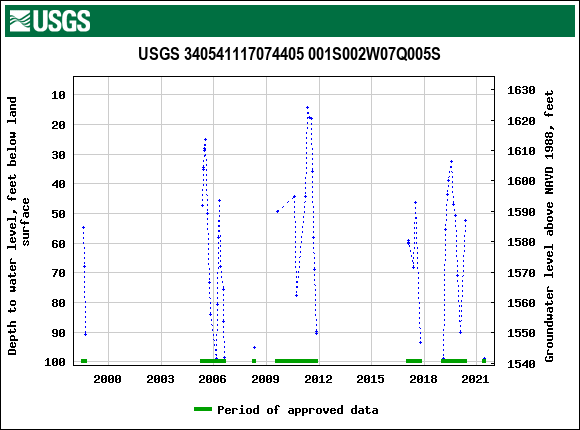
Figure 4. A hydrograph on the legacy system after the data fixes were applied, showing unsuccessful measurements being dropped from the hydrograph. The unsuccessful measurements are available in a data table, but are not displayed on the graph and are not represented as a number
If you have additional questions or comments on groundwater-level data delivery, we encourage you to email us at wdfn@usgs.gov.
Categories:
Keywords:
Related Posts
Decommissioning Groundwater Watch
August 1, 2022
What are you decommissioning? In September of 2022, the USGS is shutting down (decommissioning) the Groundwater Watch application. This web application has served groundwater level data and statistics since 2006.
Introducing the National Groundwater Conditions web application
October 5, 2023
Summary We are excited to release an experimental web application that provides a searchable map interface and at-a-glance site summary statistics and visuals of current groundwater levels relative to historic values.
Check Status Users
December 29, 2021
As described in the WDFN user blog, we discovered three key user groups which we use to design our delivery of USGS water information. Here is a quick recap of the three user groups:
Explore & Download Users
December 29, 2021
As described in the WDFN user blog, we discovered three key user groups which we use to design our delivery of USGS water information. Here is a quick recap of the three user groups:
Operationalized Pull Users
December 29, 2021
As described in WDFN user blog, we discovered three key user groups which we use to design our delivery of USGS water information. Here is a quick recap of the three user groups: