
Groundwater Field Visit Data on Monitoring Location Pages
An overview of new features tied to the modernization of groundwater levels field visit data display.
The USGS Water Mission Area has recently completed a migration of groundwater field visit data from a legacy data system to a new, centralized datastore. Alongside this work, we have been building a new modernized dataflow (technical blog post coming on that soon) as well as bringing the display of groundwater field visit data on the monitoring location pages.
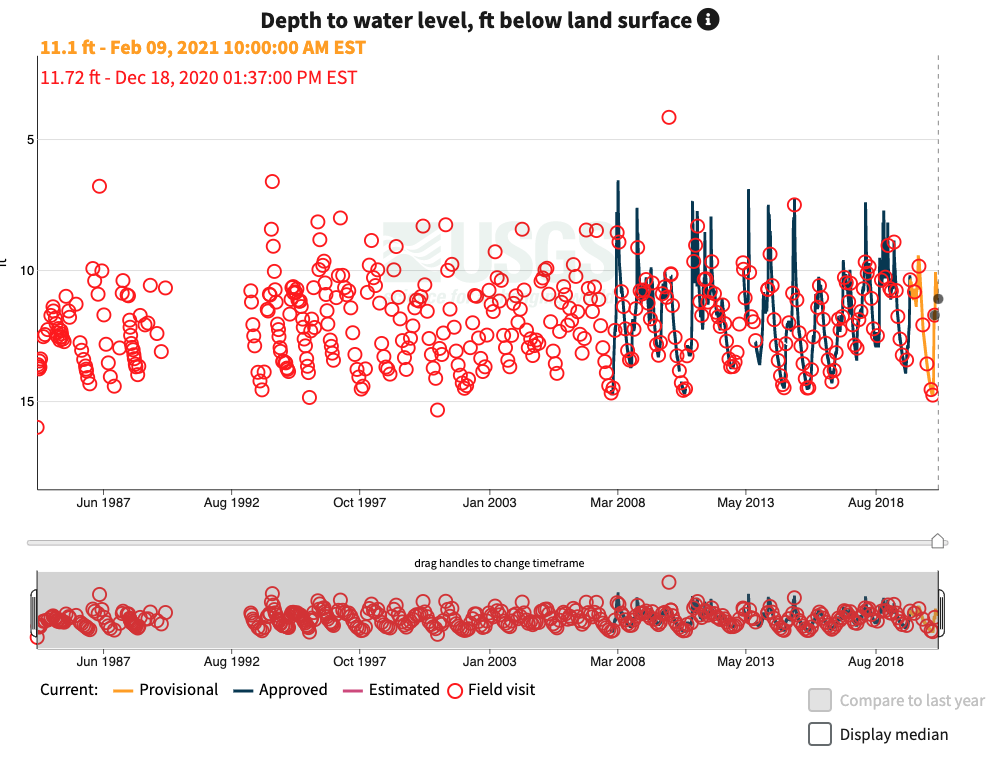
Image of hydrograph from CT-SC 22 SCOTLAND, a well in Windham County, CN containing field visit and instrumented groundwater level data
Field visit data (discrete data) were added to the hydrograph and are now visible alongside instrumented data. This new view allows users to better understand long-term trends and conditions at sites over the entire period of observation, not just since the site has been instrumented. In addition to adding the field visit points to the hydrograph, the field visit data was added to the data tables:
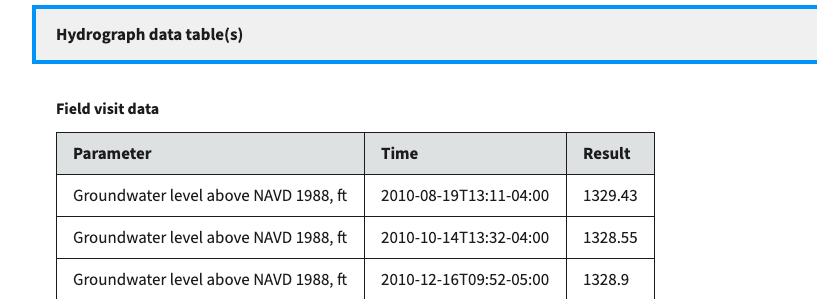
Field visit data section showing groundwater level data
Data shown in hydrographs are now easily accessible in the data download section:
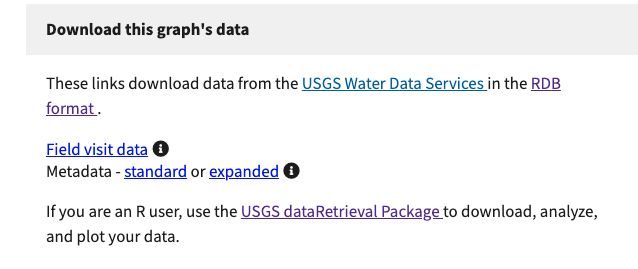
Download section showing field visit data access options
Locations that only have field visits have the data displayed on hydrographs. This improvement makes our interactive hydrographs accessible at many more sites nation-wide, and allows users to visualize the full period of record at sites that are not instrumented and contextualize recent measurements.
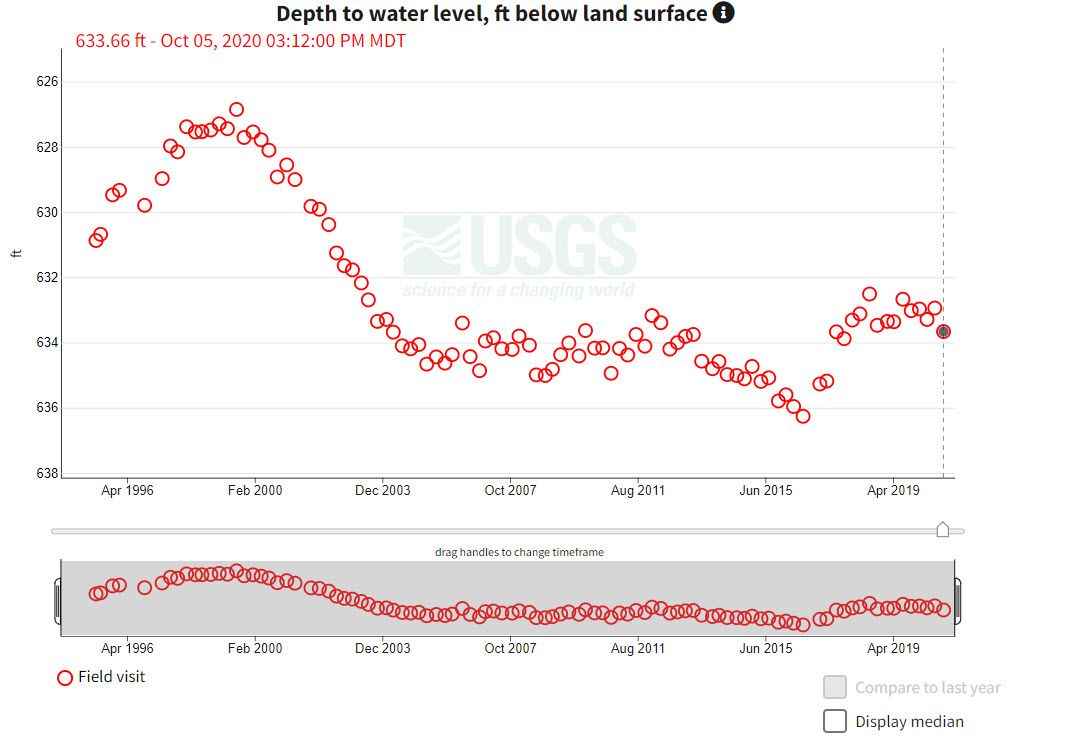
Hydrograph for 01N 29E 08BCD1 USGS 125, a well in Butte County, ID with only field visit data
Groundwater field visit data are collected when staff visit wells, boreholes, piezometers, or springs and measure the water-level of the groundwater at that site. USGS and other scientific organizations have been collecting groundwater level data for decades in this manner. This longer period of record that is available by viewing both instrumented and field visit data is now represented by the period of record snapshot on monitoring location pages.
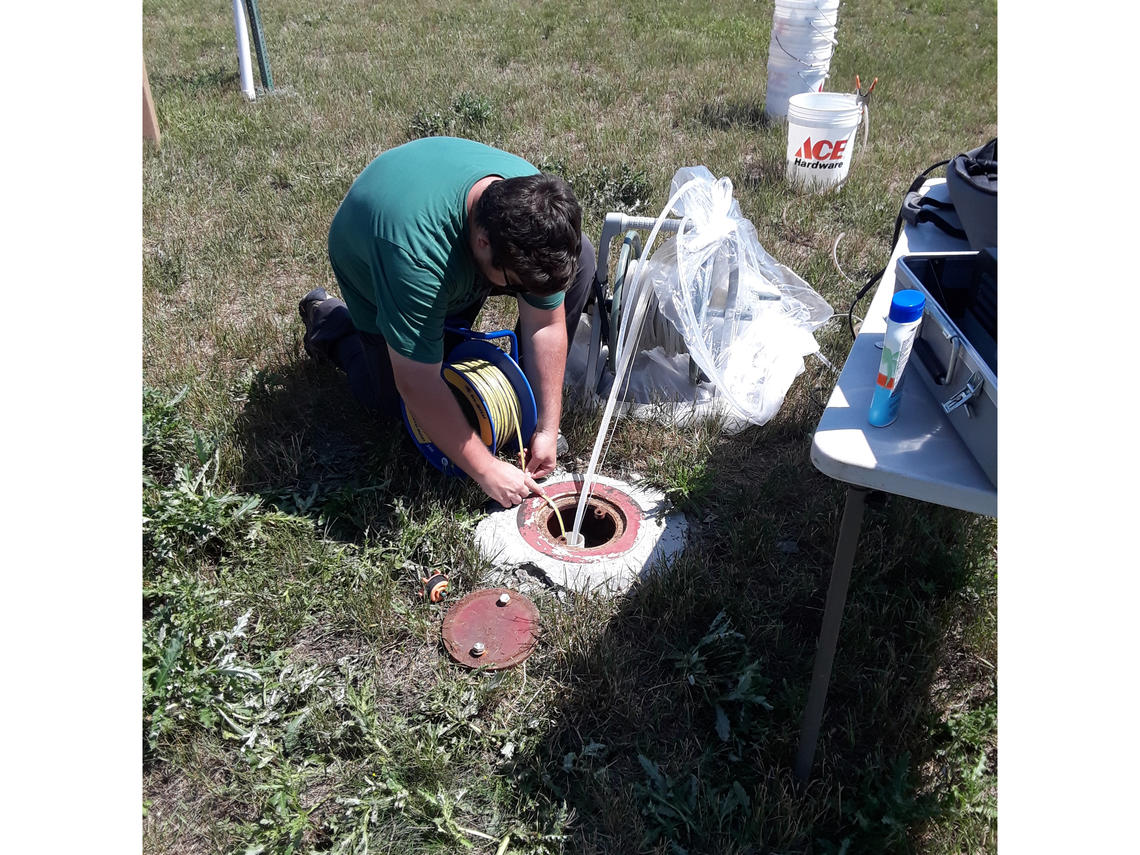
Student hydrologist Todd Anderson assisting with water measurements and purging of a well at a research location at Ellsworth Air Force Base in South Dakota. The resulting measurement is field visit data. Photo Credit: Kathy Durham.
Categories:
Related Posts
Modernizing How You Access Water Data | Webinar on Oct 13 | Recording Available
October 1, 2021
Missed the webinar? Watch the recording The recording of this webinar can be viewed on the USGS website or on the USGS YouTube channel. Let us know your thoughts!
FAQ for Next Generation Monitoring Location Pages
September 24, 2021
Last updated May 3rd, 2022 For ease of use, we recommend you CTRL+F (for Windows) or Command+F (for Mac) to search this page for the section that relates to your question.
How to Use Next Generation Monitoring Location Pages
September 8, 2021
Last updated April 7th, 2022 Welcome to our how-to guide for WDFN's Next Generation Monitoring Location Pages Looking for guidance on how to use the NextGen pages?
Next Generation Monitoring Location Pages Go Live Soon!
August 17, 2021
Last updated October 21, 2021 To learn more about these changes, watch the recording of our October 2021 public webinar. What are Monitoring Location Pages? Monitoring location pages are web pages that the USGS Water Mission Area offers to display important water data like discharge (also referred to as streamflow), gage height, precipitation, water-levels, temperature, etc.
The Network Linked Data Index and geoconnex.us
May 14, 2021
The NLDI is a search engine that uses the river network as it’s index. Like a search engine, it can cache and index new data. Beyond indexing and data discovery, it also offers some convenient data services like basin boundaries and accumulated catchment characteristics.