
Introducing the National Groundwater Conditions web application
A new, experimental application for viewing groundwater levels with historical context and for generating site-level reports.
Summary
We are excited to release an experimental web application that provides a searchable map interface and at-a-glance site summary statistics and visuals of current groundwater levels relative to historic values. This application provides some of the core functionality available in the former Groundwater Watch application.
Overview of the National Groundwater Conditions application
Groundwater is a critical resource for many people, and the USGS generates groundwater level data for thousands of sites across the United States and outlying territories. The ability to put current groundwater data into a long-term historical context is valuable in understanding trends in groundwater use at a particular monitoring location, region, or at the national scale. In 2022, the web application Groundwater Watch was shut down and a long-term replacement is in development. Here, we introduce National Groundwater Conditions, a national-scale web application that maps active groundwater levels and enables users to explore site-level groundwater data with a historical context. The application provides information for understanding long-term trends in groundwater availability at a particular site and for managing critical groundwater resources. It delivers the core functionality that was previously available in Groundwater Watch.
Access the application here , or at the following link: https://rconnect.usgs.gov/gwapp/ .
This tool is being released as an experimental product. In the future, the functionality available in the application will be integrated into our existing USGS water applications such as the National Water Dashboard and Monitoring Location Pages; these applications have a wealth of additional mapping features and functionality.
How to use the web application
The National Groundwater Conditions application has a national map to view current groundwater levels relative to historic values for all actively monitored sites. It includes data from USGS sites as well as non-USGS sites that are part of the National Groundwater Monitoring Network (NGWMN).
The page opens with a popup window that provides news and guidance on using the application. Users can go back to these references any time while using the application by toggling to the About tab. Once loaded, a map will appear. Use the ‘Map Controls’ pane on the left to filter the national dataset to sites of interest. Users can filter based on state/territory 2-letter code, national aquifer, data type, current flow percentile class, inclusion in the Climate Response Network , or recency of data (default is 730 days). The data presented in this map are updated daily.
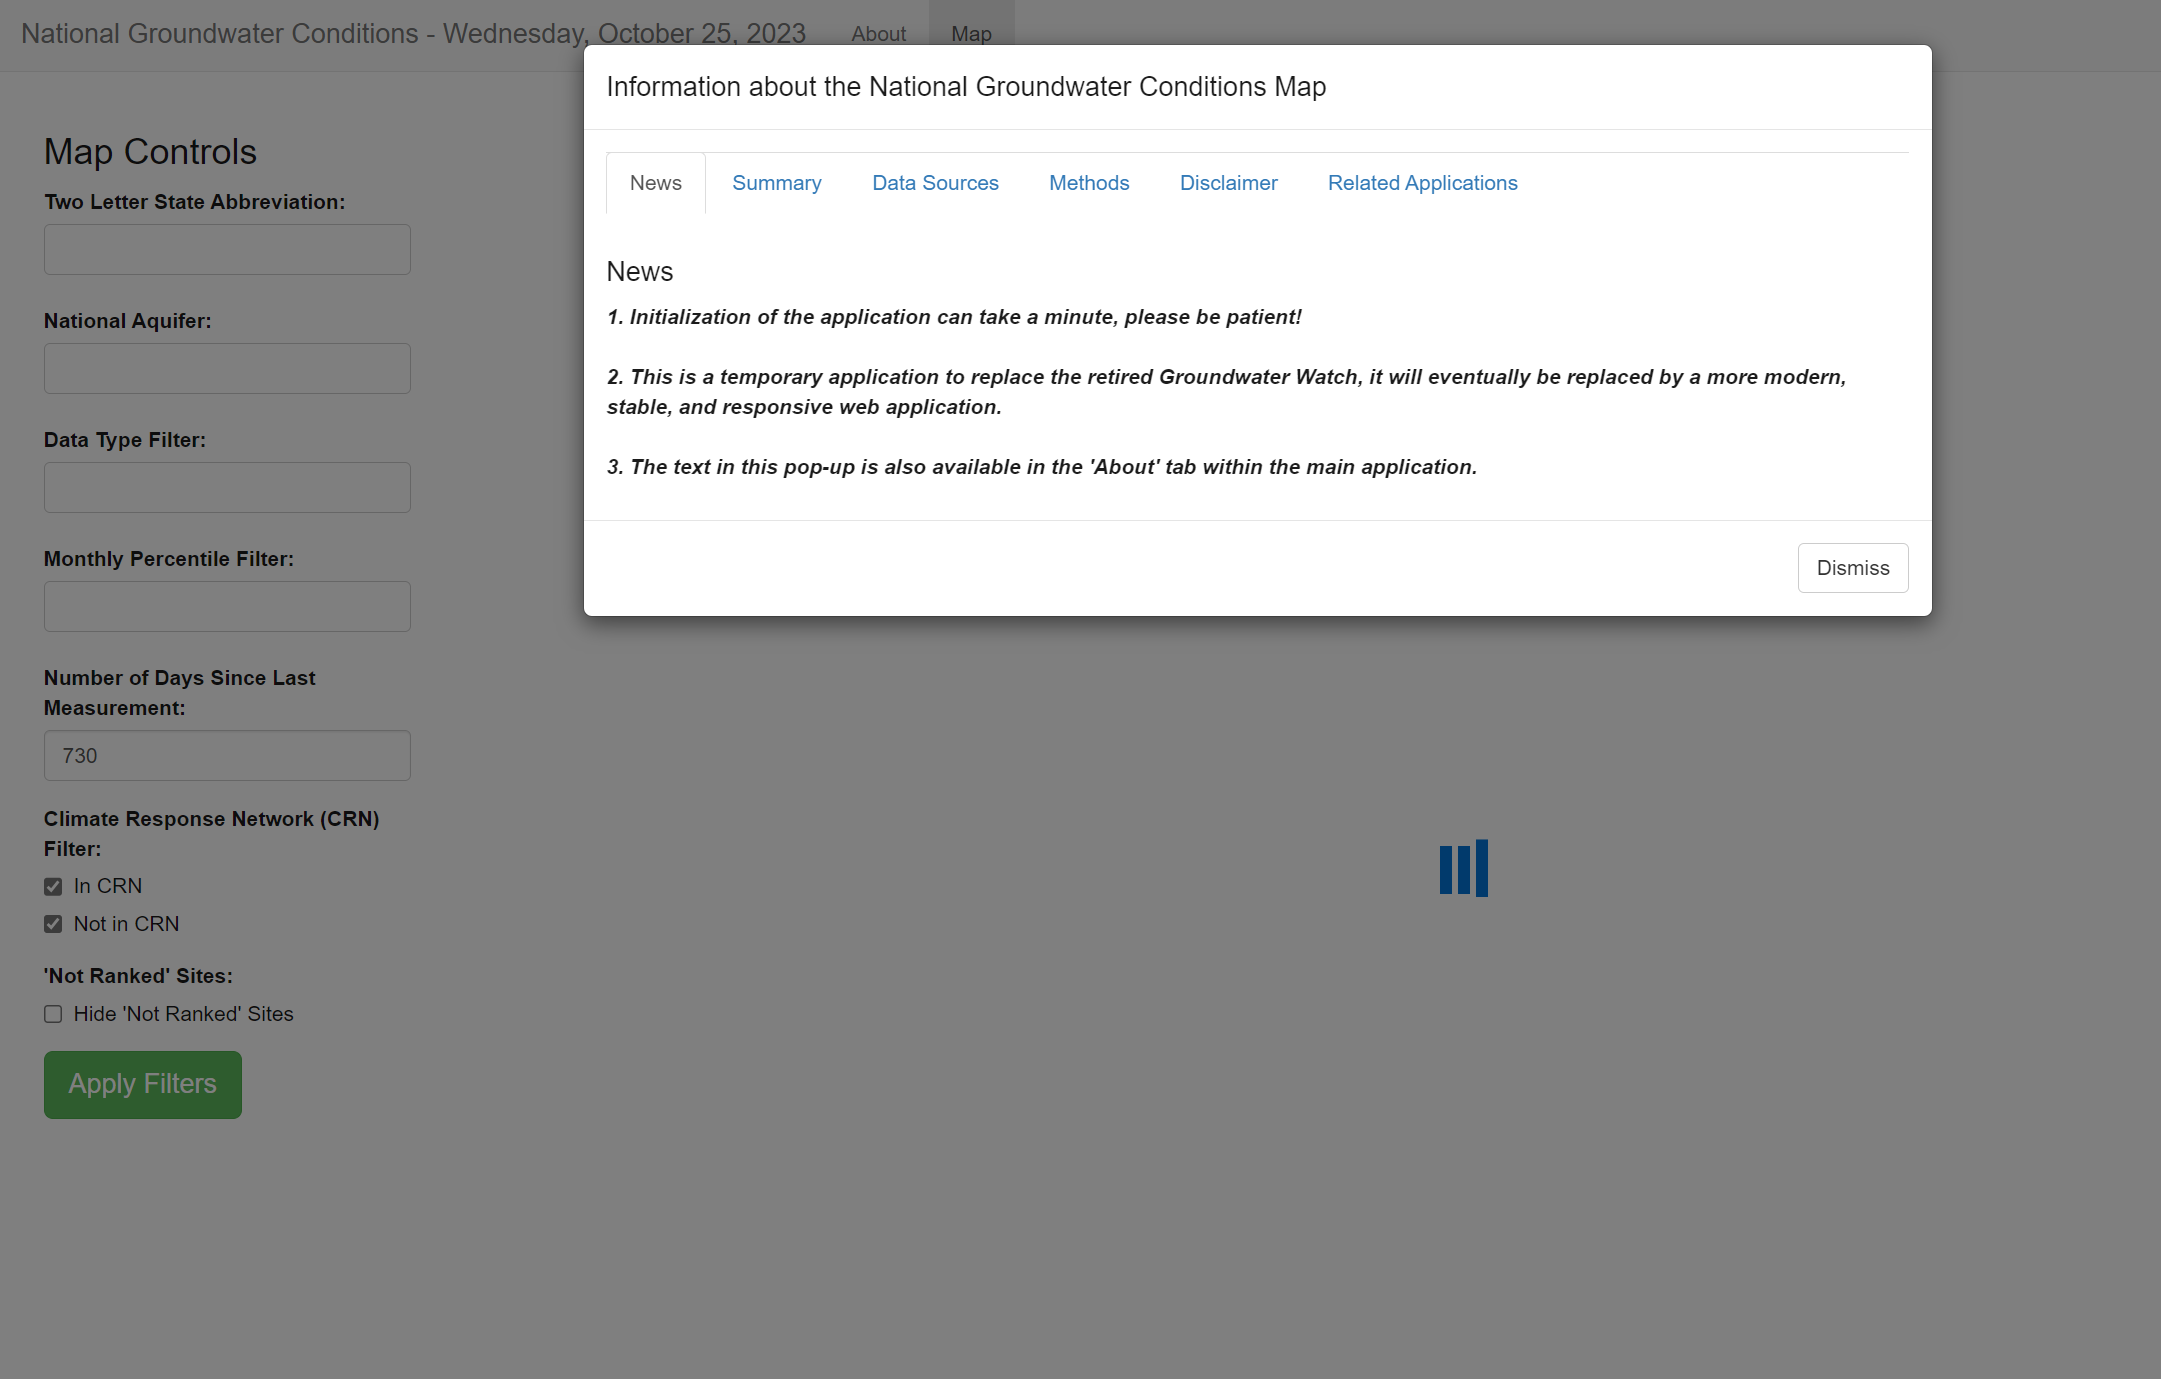
When opening the web application, a window pops up with news and other important information. It may take a few moments for the page to load, so please be patient!
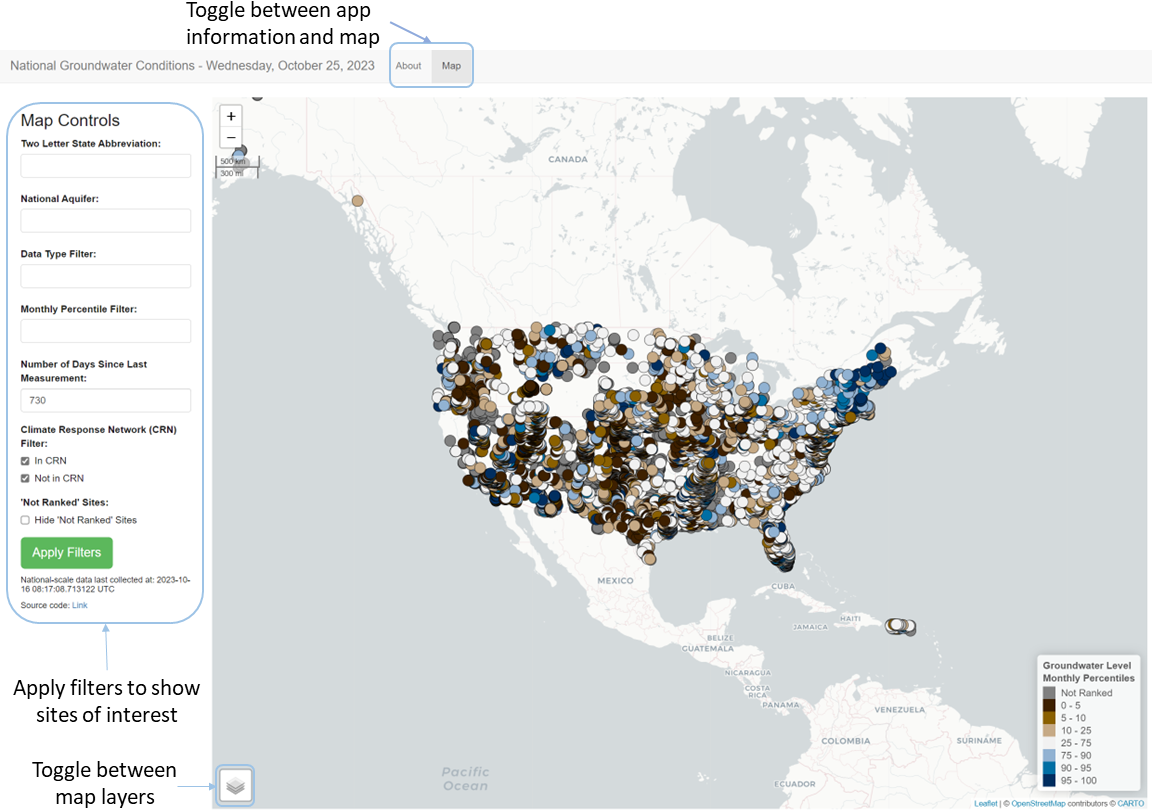
Landing page for the national mapping application. Use the Map Controls pane on the left to select sites of interest and click ‘Apply Filters’ to update the map. Users can modify the base map and add layers such as national aquifer boundaries.
For example, a user may be interested in sites located in Kansas with groundwater levels that are at or below the 25th percentile of mean historic levels. Scroll down below the map to view a Summary Table listing the sites that meet the search criteria.
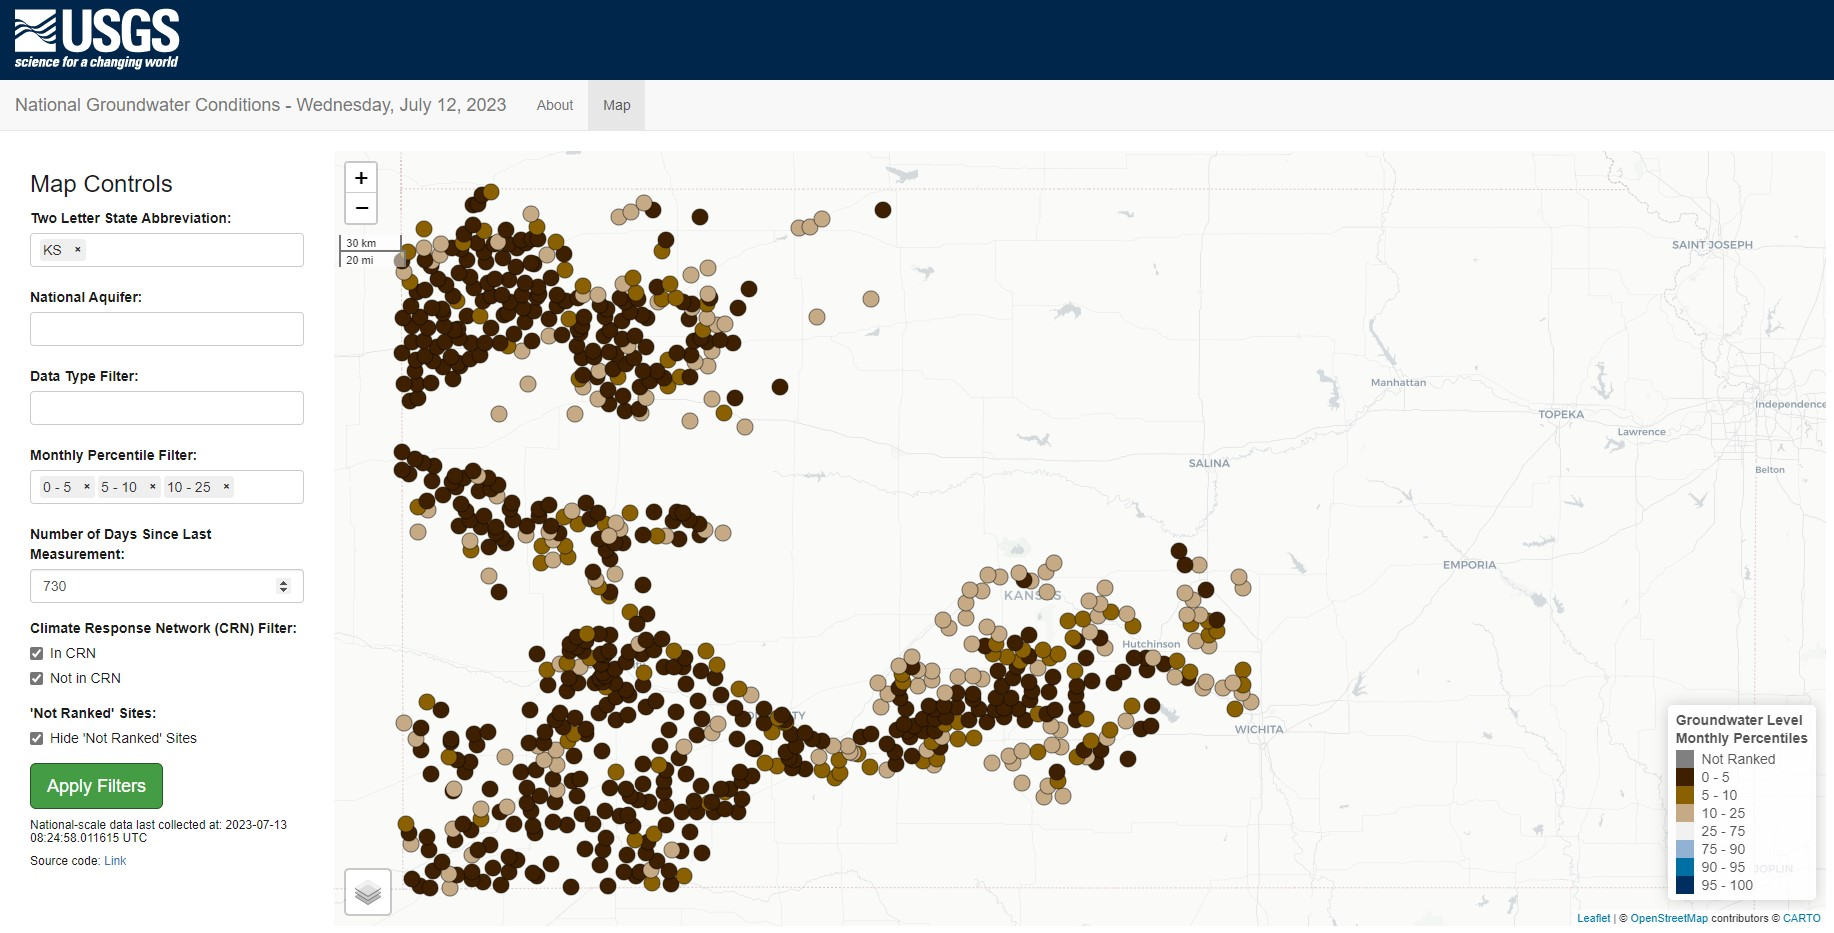
An example query selecting a single state (Kansas, KS) for sites that are currently experiencing below average water levels (defined here at 25% of normal and below). The “Hide ‘Not Ranked’ Sites” option was selected, which restricts the data to sites with at least 10 years of data, which is the minimum record length.
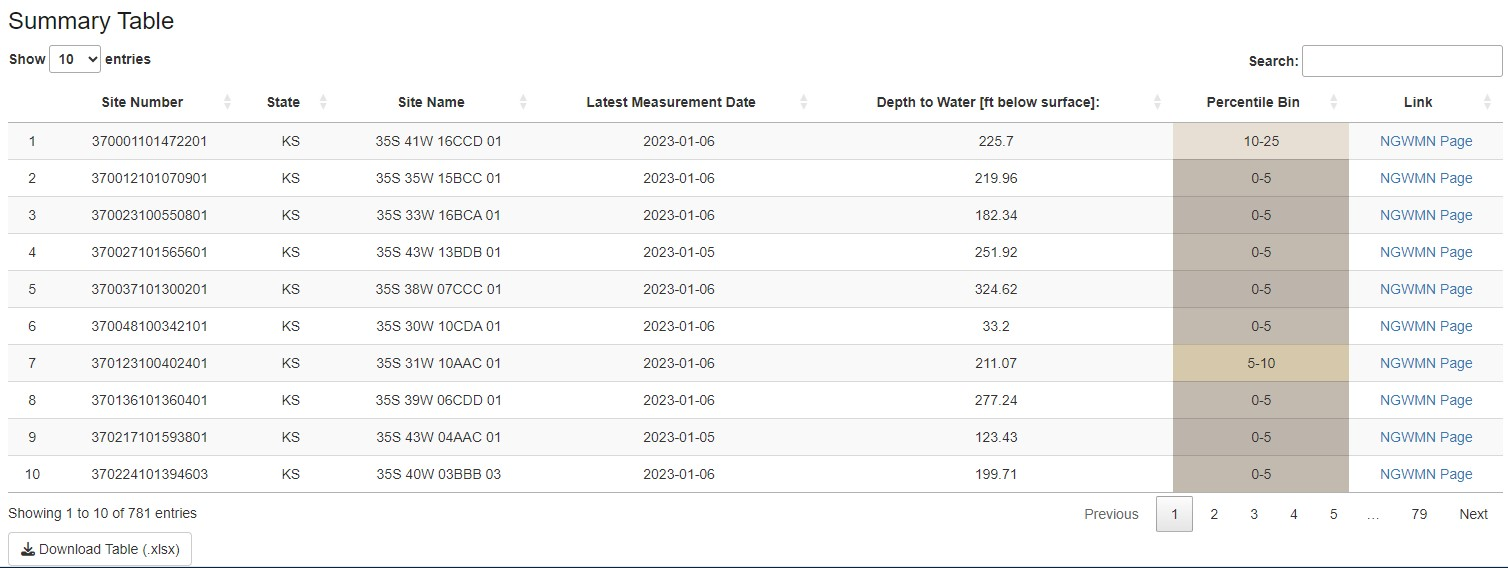
Scroll down below the map to view a summary table listing the sites meeting the search criteria. Users can access links to site-level information from the summary table as well as the map. Click on the “Download Table” button to download the site summary table in MS Excel format.
Clicking on a colored dot opens a pop-up window with location-specific information including site name, most recent depth to water level, and percentile bin. There are also links to additional location information, including:
- A link to the WDFN Monitoring Location page
- A ‘Site Page’ containing a monitoring location report, which includes monthly groundwater level statistics graphs and a site statistics summary table
- Locations that are part of the National Groundwater Monitoring Network will have a link to the location’s NGWMN page
The links are also available in the Summary Table.
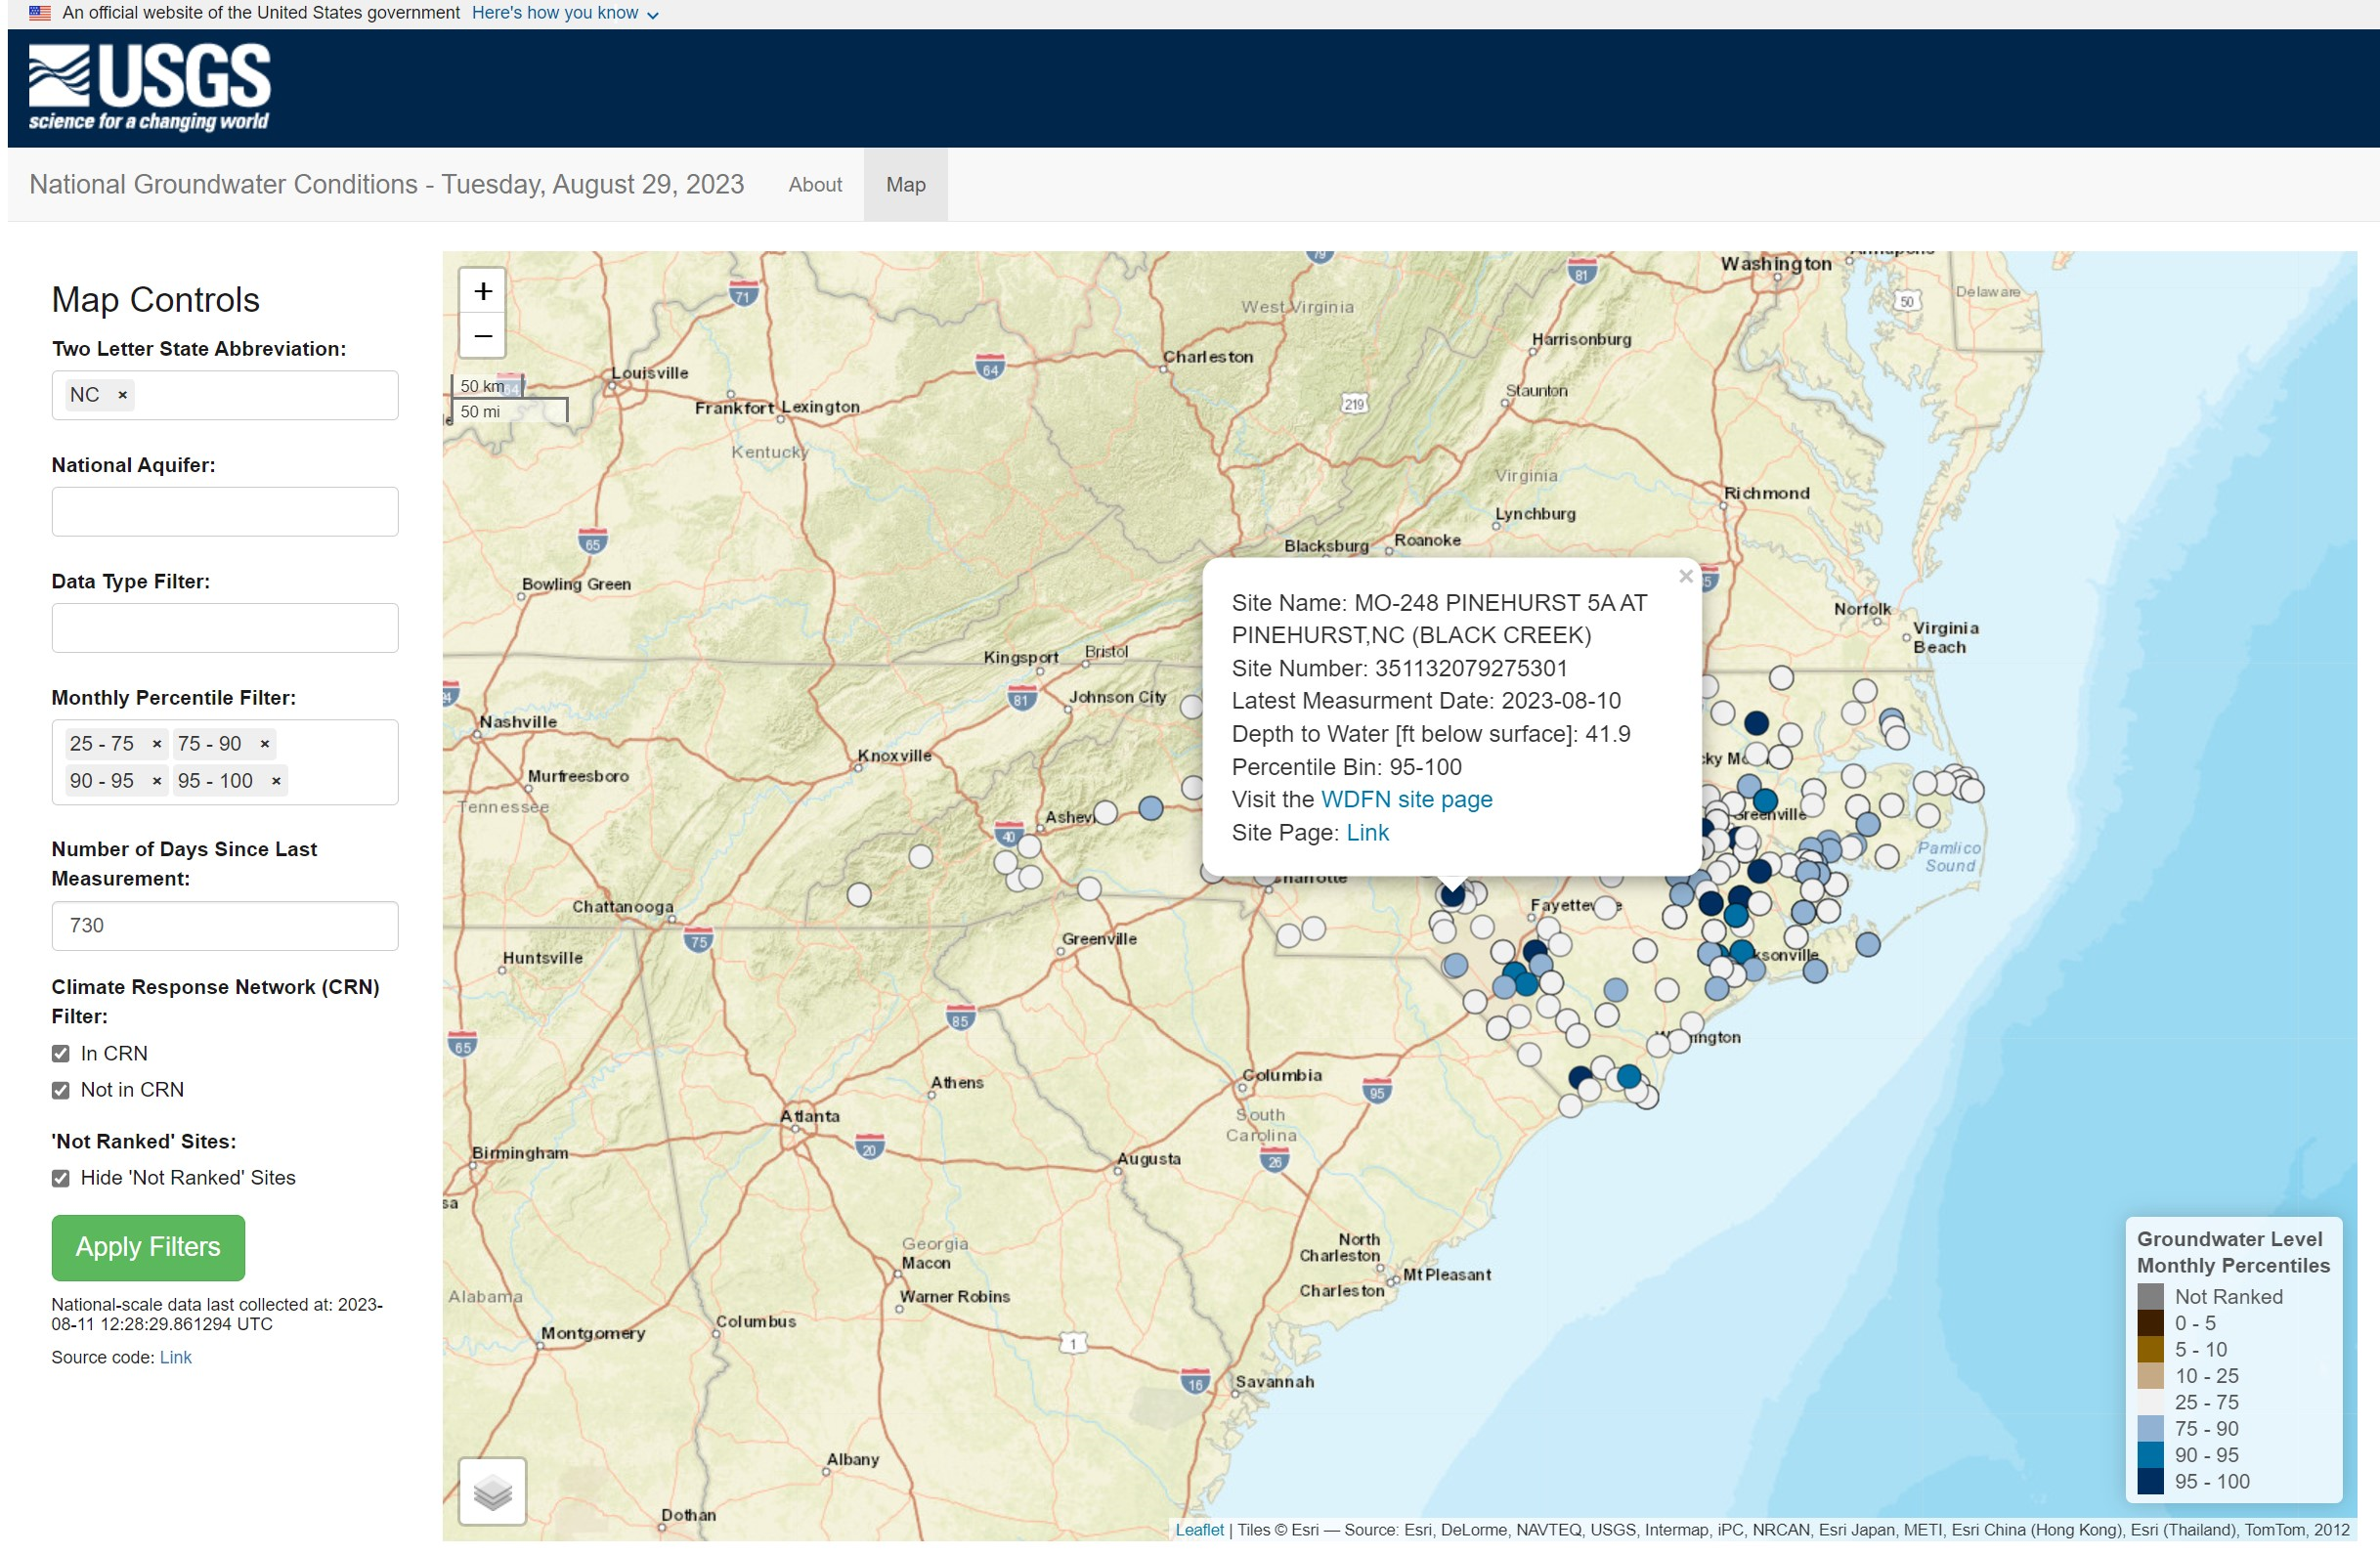
Click on a monitoring location from the map to open a pop-up window with location metadata and links to location-specific pages. The “Site Page” link opens a new browser tab with a site report, which displays a table of summary information as well as monthly groundwater level statistics plots and a site statistics summary table. The “WDFN site page” link takes a user to the WDFN monitoring location page.
View groundwater level statistics for a monitoring location
The Site Page provides location metadata and groundwater levels summary statistics in graphical and tabular formats. These visuals are designed to give users quick access to the current (within the past 24 hours) groundwater level conditions with comparisons to monthly historic means for rapid assessment and decision-making. The tables and graphs are exportable for creating reports and presentations, and the Site Page itself has a stable URL to simplify sharing and collaboration.
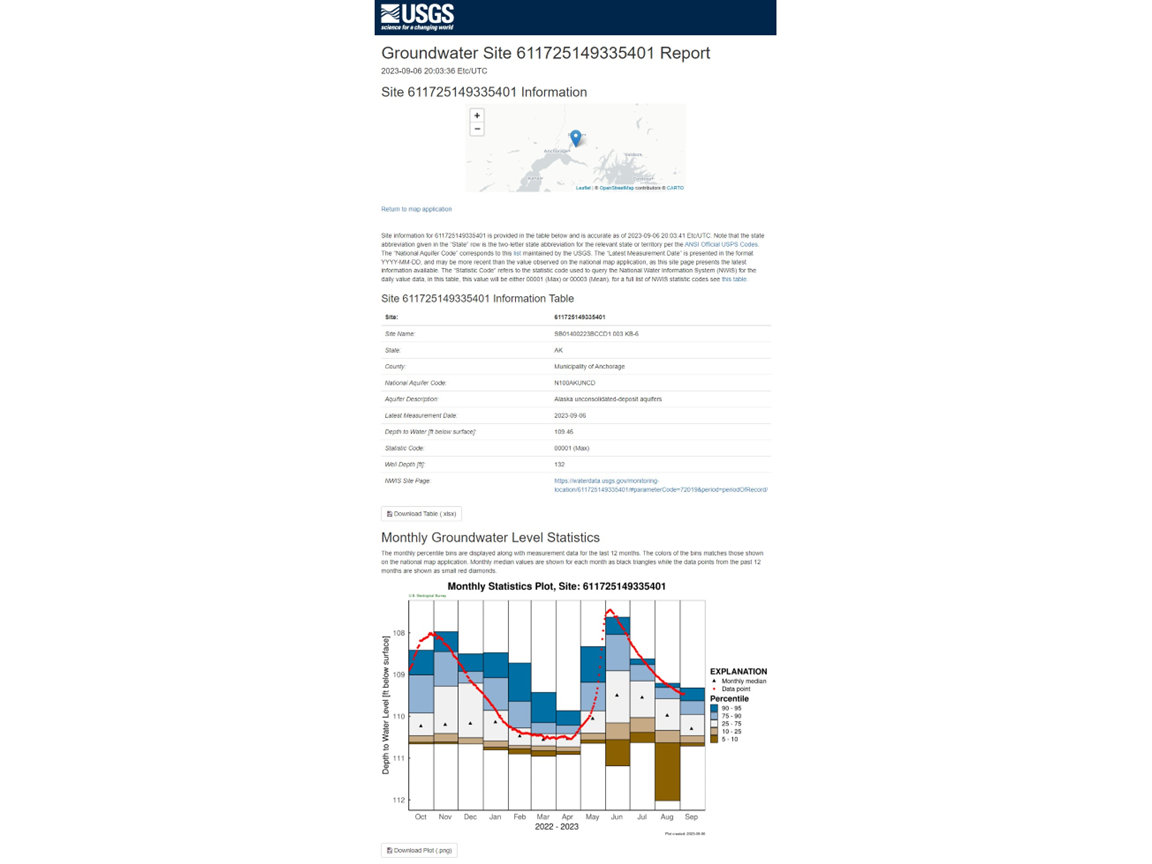
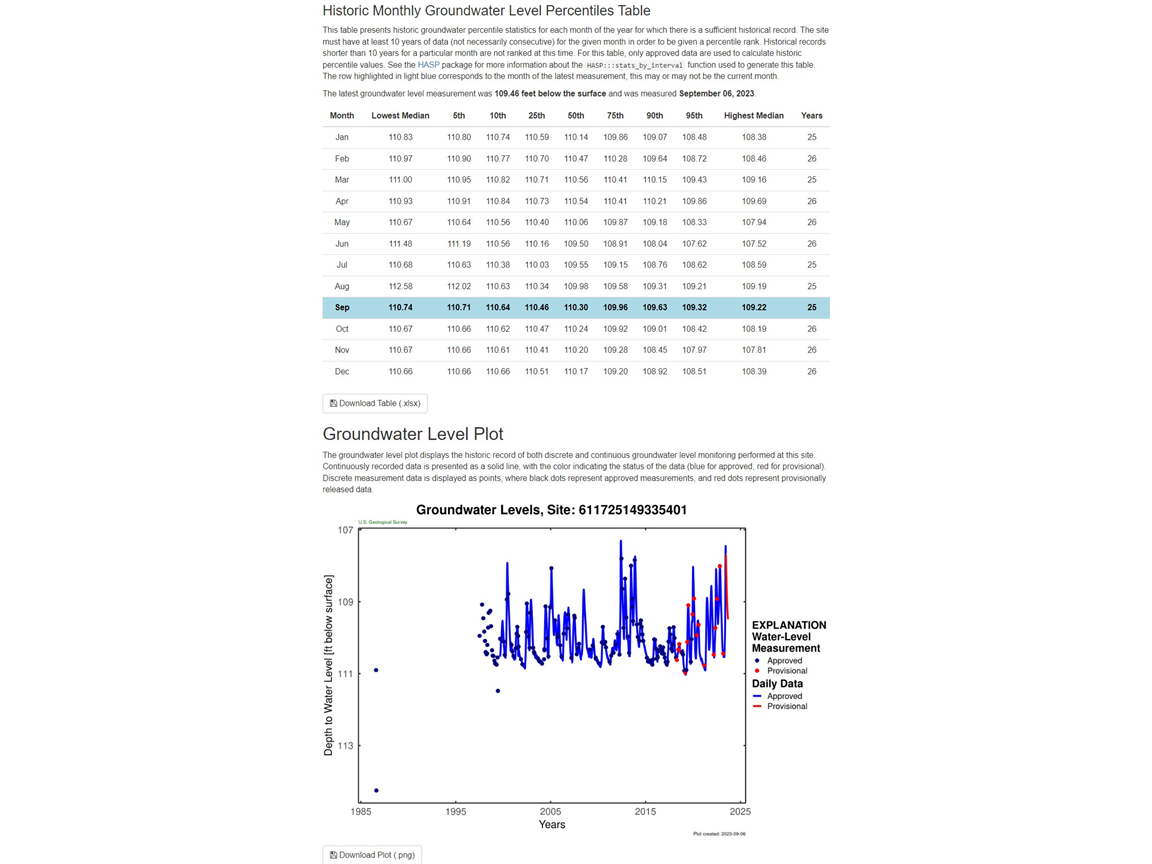
The Site Report provides site location metadata and current groundwater levels data. The Monthly Groundwater Levels plot shows the most recent 12 months of mean monthly groundwater levels relative to the historic monthly levels, which are shown as percentile groups. The historic median value and the most recent measurements are shown as points on the plot. A summary table appears below the chart. At the bottom of the Site Report, a time series plot shows groundwater levels data for the full period of record by merging discrete and continuous data. Note that both approved and provisional data are shown.
The technical details
The application performs calculations and generates graphics using aggregated groundwater levels data and statistics obtained from an R package, called Hydrologic Analysis Package (HASP), which can aggregate individual site visit groundwater levels (e.g., discrete) data with data from a deployed sensor (e.g., continuous) into a single record. This enables viewing a longer time series data set for many sites. For more information on HASP, check out this blog post .
The Climate Response Network
The mapping application includes a filter for sites that are part of the Climate Response Network (CRN). This is a network of wells and springs to monitor the effects of droughts and other climate variability on groundwater levels.
Let us know what you think!
Please let us know if this tool is serving your needs. If you have any questions or run into technical problems, please contact us at comptools@usgs.gov .
We often seek volunteers to help us test our products. If you are interested in getting involved, please contact us at wdfn_usabilitytesting@usgs.gov .
Any use of trade, firm, or product names is for descriptive purposes only and does not imply endorsement by the U.S. Government.
Categories:
Related Posts
Updates and improvements to the National Water Dashboard
March 19, 2026
The National Water Dashboard (NWD) continues to evolve as we modernize our water-data delivery tools and improve how users discover, explore, and interact with real‑time information. Our latest set of updates focuses on simplifying the map experience, improving usability, adding new ways to customize your view, and continuing our long‑term transition away from legacy services. Below is an overview of what’s new.
Tutorial of dataRetrieval's newest features in R
November 26, 2025
This article will describe the R-package
dataRetrieval, which simplifies the process of finding and retrieving water from the U.S. Geological Survey (USGS) and other agencies. We have recently released a new version ofdataRetrievalto work with the modernized Water Data APIs . The new version ofdataRetrievalhas several benefits for new and existing users:Decommissioning Groundwater Watch
August 1, 2022
What are you decommissioning?
In September of 2022, the USGS is shutting down (decommissioning) the Groundwater Watch application. This web application has served groundwater level data and statistics since 2006. Popular features of this product include individual site pages for wells and springs, maps of current conditions, and graphs showing the statistical context of recent measurements; major functionality of Groundwater Watch is pictured in Figure 1.
How the USGS uses the WQX standard
December 27, 2023
Overview
- The Water Quality Exchange (WQX) standard is an internationally recognized data standard that makes it easier to share and use water quality data
- The USGS is expanding its current use of the WQX standard from a relatively coarse mapping for data delivered on the Water Quality Portal (WQP) to a comprehensive mapping of USGS sample data on both the WQP and the modernized USGS data portal, Water Data For the Nation (WDFN)
- Overall, USGS metadata will be more visible to users and it will be human-readable
What is WQX?
The WQX schema is a standardized data exchange format specifically for sharing water quality observational data. This data standard was developed by the Environmental Protection Agency (EPA) in conjunction with the US Geological Survey and other partner environmental organizations. The WQX schema provides a set of metadata attributes that are foundational for understanding ambient water quality observations. Users can define information about who collected samples and where, results and metadata about samples, and information that helps to contextualize results, such as habitat assessment scores and metrics.
Improved Public Delivery of Water Quality and Field Samples Data
August 24, 2023
What are sample data?
Sample data are derived from manual field collection and laboratory analyses, including for water quality, sediment, biological, air and soil samples (waterdata.usgs.gov/nwis/qwdata ). Sample data do not include data collected by continuously-measuring instruments, data from models, or simulated data.