
New Groundwater Time Series Service Available
A new data offering which consolidates instrumented and discrete groundwater level data into a data stream that yields one value per day
USGS collects water-level information at groundwater monitoring locations across the country and often produces dataset that are rich in detail down to the minute. However, not all users need datasets this rich in detail. For some people interested in trends and patterns, one value per day is sufficient. Therefore, we filter our available data into a data offering we call the Best Available Time Series (BATS) for Groundwater Levels. BATS for Groundwater Levels will provide users with a single time series with one value per day based on the best available data for that time period, removing the need for users to filter and select from multiple data sources to construct a complete record of groundwater levels.
Condensing Robust Data Sets
There are two ways that USGS measures groundwater-levels:
- A USGS scientist or hydrologic technician visits a monitoring location, such as a well, borehole, piezometer or spring, and uses a steel tape, electronic tape, or another device to measure the depth to groundwater . This is called a field visit and generates discrete groundwater-level data.
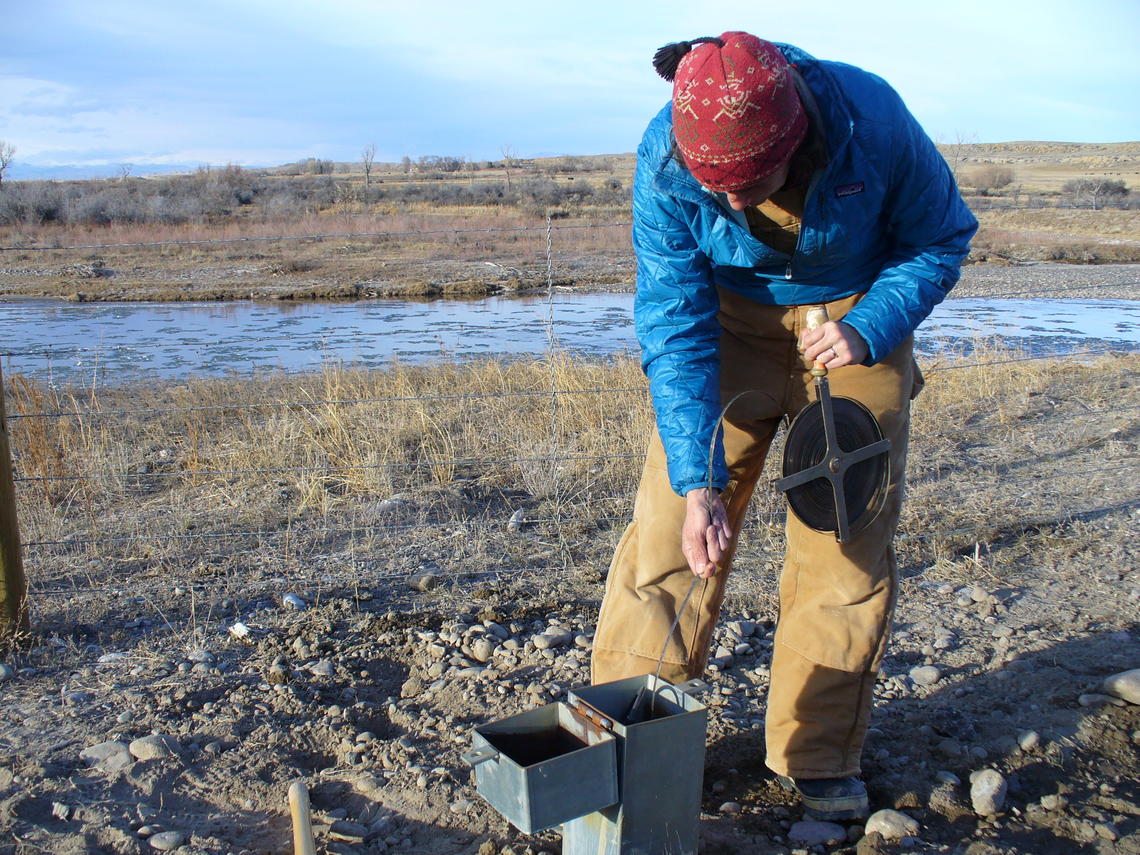
A USGS scientist measures the groundwater level using a steel tape in a shallow well near Wind River at Kinnear, WY
- An instrument called a pressure transducer can be placed in a well, borehole, or piezometer, or a streamgage can be placed at a spring. These instruments can be left at a monitoring location and collect data on a designated interval. Typically, we collect instrumented measurements every fifteen minutes. Some of these instruments relay these data to our computer systems in real-time. Other instruments are left in place and are visited every few weeks to months to obtain data. Data generated in this manner are called instrumented data or timeseries data.
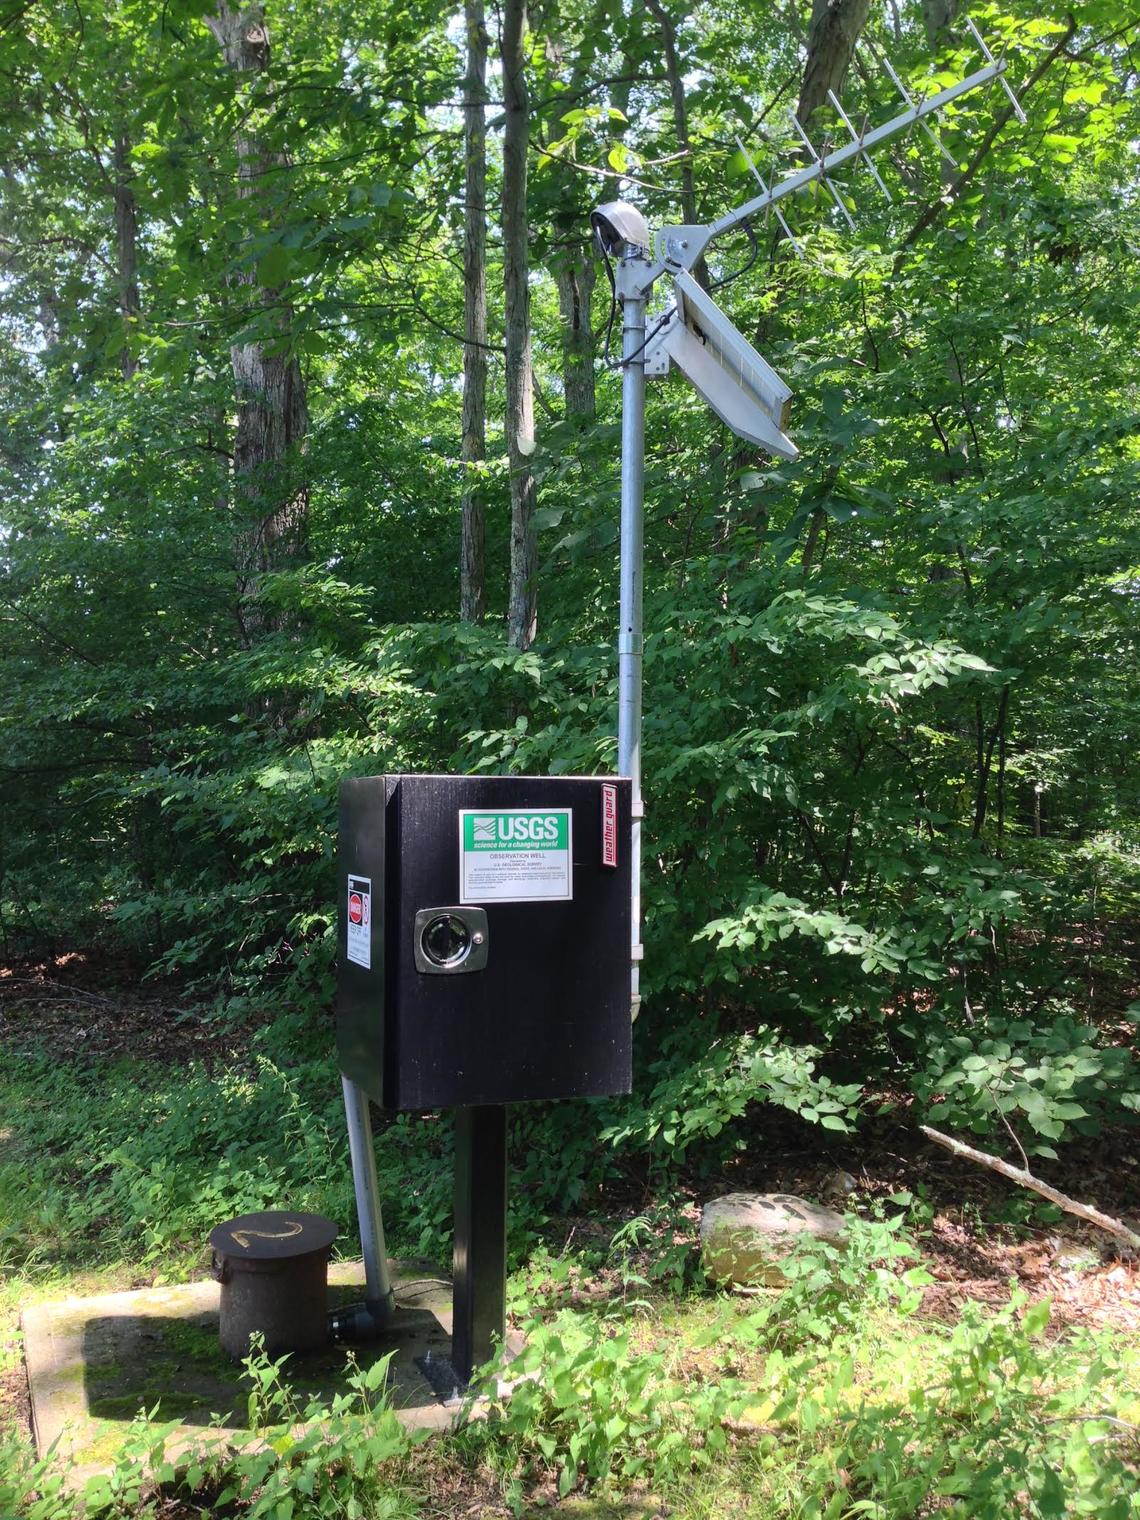
USGS groundwater site 414831072173002 in Tolland County, Connecticut. This well is equipped with a transducer and equipment that allows groundwater level data to be transmitted in real-time.
These two methods of data collection create a data-rich record with varying data frequency over time; you can see this in our many groundwater monitoring location pages . Due to changing methodology over time, we often serve the data using multiple methods or parameters over the period of record. We also calculate some statistics from instrumented data called daily value data. This metadata is important, but may not consistently be available over the period of record.
This can be confusing to someone who just wants to know “How has the groundwater level changed over the entire period of measurement?” To help answer that question, we are now providing a simpler data offering for groundwater levels. Our algorithm determines the longest period of record available by merging discrete and instrumented data, and delivers one measurement per day to represent groundwater levels at a site.
How do we know which record is “best”?
We determine the Best Available data records by:
merging discrete and instrumented data of the same parameter code into one combined record,
choosing the water-level value from a parameter code that the monitoring location is currently serving, and
choosing the parameter with the longest running record if the location is currently reporting multiple groundwater-level parameters, and
serving the discrete value instead of the instrumented value if they happen on the same day (because we use discrete visits to calibrate instrumented records).
This method allows us to serve one value per day that represents groundwater levels.
Aren’t we omitting important data?
A Best Available Time Series for Groundwater Levels is designed to be a simplified offering of our very rich data sets; it is optimal for calculating trends and statistics or comparing sites. We also have filtered both our instrumented and timeseries data, so you can select that if it is your only focus. Our Groundwater Levels Service is still available for those who would like more detailed data. These data are also available for download or for interactive viewing on Monitoring Location Pages .
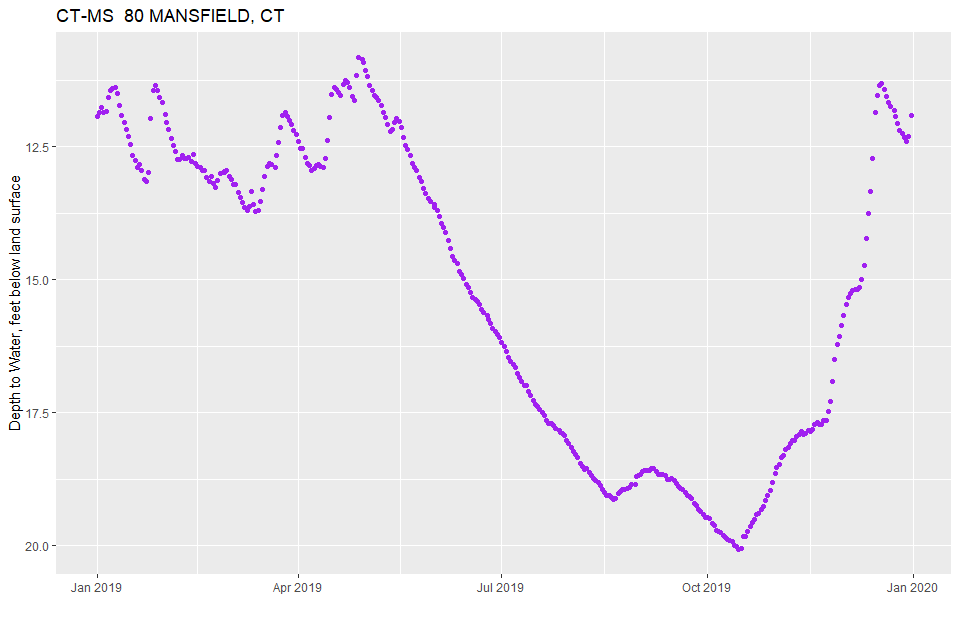
All groundwater level observations for one year, including instrumented data (solid blue line, representing measurements every fifteen minutes) and discrete data (red dots) representing site visits at site 414831072173002. Best Available Time Series, or one value per day, for one year, representing instrumented data and discrete data at site 414831072173002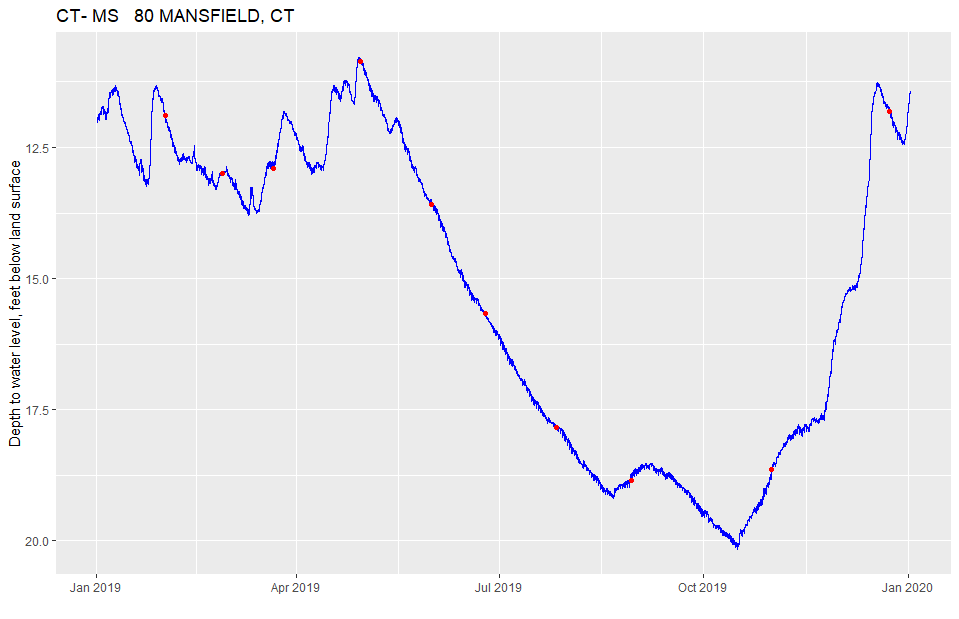
Potential Uses in the Future
We use Best Available Time Series for Groundwater Levels to calculate and display groundwater-level trends in the National Groundwater Monitoring Network Data Portal . The Best Available Time Series for Groundwater Levels may be involved in future efforts, such as the eventual replacement of the USGS Groundwater Watch website. Best Available Time Series also could be used by hydrologists and data scientists who are focused on local to regional scale trends and patterns in groundwater levels.
Beyond the realm of groundwater, we may investigate whether this Best Available Time Series concept can be extended to data records at rivers. For example, many USGS streamgaging stations with long historical records began publishing datasets rich in detail in 2007. But thousands of these streamgages offer a longer historical record—one data value per day—back to the 1930s or even earlier. And even before daily data values were collected, some streamgages have scattered discrete measurements—or sometimes just one maximum value for the entire year—published as far back as the 1890s or even earlier! Combining some or all of these types of data into a Best Available Time Series could be compelling for general visualizations, and uniquely valuable for assessments of long-term trends or other patterns.
Many USGS subject matter experts helped us work through the subtle aspects of this logic, and we appreciate their insight and contributions. Please let us know your thoughts about this new data offering by emailing gs-w-iow_po_team@usgs.gov.
Categories:
Related Posts
How we work on the Water Data for the Nation Team
March 9, 2021
The USGS Water Mission Area (WMA) is the largest provider of real time and historical water information in the world. A major part of our work in the WMA Web Communications Branch is to build modern web applications and APIs to make these data publicly available. We call our data delivery product line Water Data for the Nation (WDFN). Here’s our product vision:
Updates and improvements to the National Water Dashboard
March 19, 2026
The National Water Dashboard (NWD) continues to evolve as we modernize our water-data delivery tools and improve how users discover, explore, and interact with real‑time information. Our latest set of updates focuses on simplifying the map experience, improving usability, adding new ways to customize your view, and continuing our long‑term transition away from legacy services. Below is an overview of what’s new.
Introducing the National Groundwater Conditions web application
October 5, 2023
Summary
We are excited to release an experimental web application that provides a searchable map interface and at-a-glance site summary statistics and visuals of current groundwater levels relative to historic values. This application provides some of the core functionality available in the former Groundwater Watch application.
Decommissioning Groundwater Watch
August 1, 2022
What are you decommissioning?
In September of 2022, the USGS is shutting down (decommissioning) the Groundwater Watch application. This web application has served groundwater level data and statistics since 2006. Popular features of this product include individual site pages for wells and springs, maps of current conditions, and graphs showing the statistical context of recent measurements; major functionality of Groundwater Watch is pictured in Figure 1.
Check Status Users
December 29, 2021
Here at WDFN, we employ user-centered design to build better products and reduce risk. This blog is one of a five-part series on users of WDFN: Are You a USGS Water Data User? | Water Data For The Nation Blog .