
Decommissioning Groundwater Watch
The legacy Groundwater Watch application is being decommissioned. This blog post explains where users can find similar functionality in other publicly available products.
What are you decommissioning?
In September of 2022, the USGS is shutting down (decommissioning) the Groundwater Watch application. This web application has served groundwater level data and statistics since 2006. Popular features of this product include individual site pages for wells and springs, maps of current conditions, and graphs showing the statistical context of recent measurements; major functionality of Groundwater Watch is pictured in Figure 1.
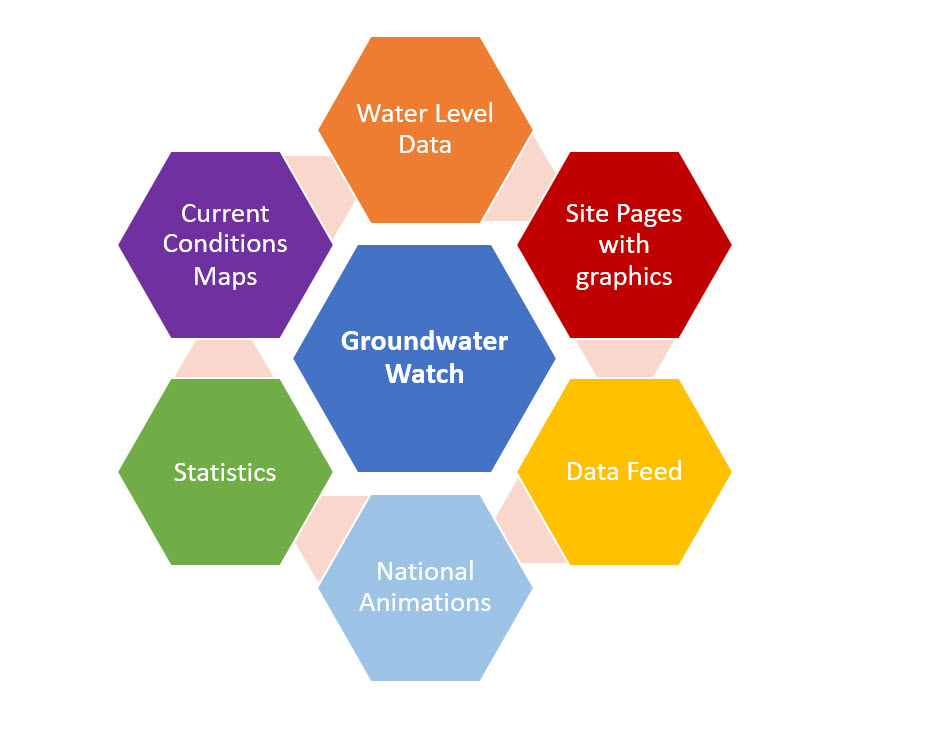
Figure 1. A diagram indicating functionality offered by the Groundwater Watch Application.
However, the application’s architecture, aging code base, and other factors make it difficult to update and keep secure. In the coming years, modern software replacements of the unique groundwater functionality will be developed by USGS Water. In the meantime, users can access other USGS products with similar functionality. You can determine which products best suit your needs as described below.
Where can I find water level data after the application is turned off?
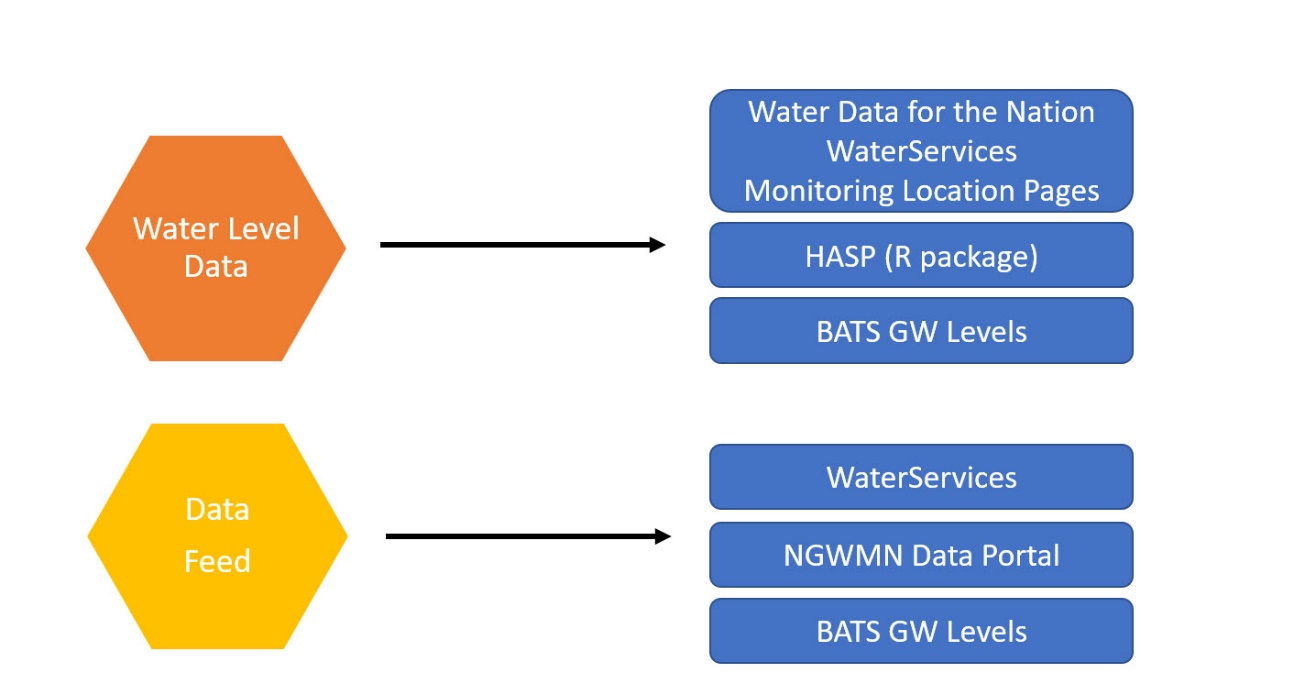
Figure 2. A diagram indicating that water level data and data feeds are available from sources outside of Groundwater Watch
Unprocessed groundwater level data are always available on Water Data for the Nation ; this website is the best place to get our most recent, uninterpreted data. Users can search and download water-level data on Water Data for the Nation, or programmatically access these data via WaterServices . Users can interactively explore water-level data for individual sites on our Next-Generation Monitoring Location Pages .
One of the features users like about Groundwater Watch is that it combines two sets of water level data, instrumented data and field visit data, into one data stream. Two new tools also offer access to this consolidated data set: the HASP package in R and the Best Available Time Series service . Both options allow users to access consolidated data sets that are not available directly from Water Data for the Nation. The National Groundwater Monitoring Network (NGWMN) Data Portal uses the Best Available Time Series (BATS) service to populate data for USGS groundwater sites in the National Groundwater Monitoring Network; this product also offers web services and another method of accessing the consolidated data set, but at a smaller set of USGS wells.
Where can I find groundwater level maps after the application is turned off?
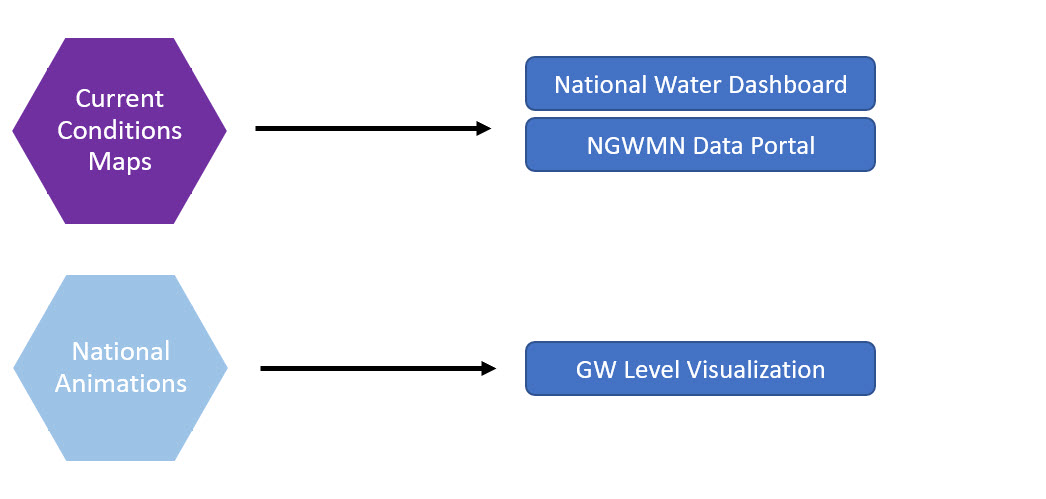
Figure 3. A diagram indicating that maps and visualizations are available from sources outside of Groundwater Watch
Users have come to rely on Groundwater Watch to deliver simple maps that display the statistical context of recent measurements through colored dots. Animations of these dots over time are a feature that has been used to show changing conditions over time. This feature was so popular that aspects of it are replicated in the NGWMN Data Portal and in the National Water Dashboard . In each of these products, a site is represented by a symbol indicating the status of the most recent measurement, if enough data are available at that site.
The USGS VizLab produced a visualization of current conditions of wells that have continuous data and at least three years of available data. The current iteration of the animation contains about 2,300 wells. The visualization will be updated over time, and the code behind it is publicly available to be used by anyone.
Where can I find groundwater level statistics and graphs after the application is turned off?
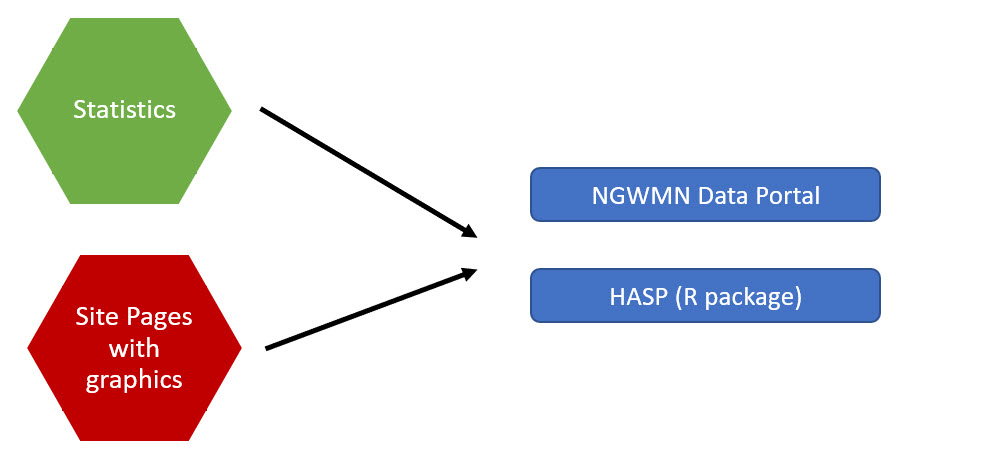
Figure 4. A diagram indicating that statistics for groundwater level data are available from sources outside of Groundwater Watch
The detailed statistics and graphical representation of water-level data on site pages are some of Groundwater Watch’s most popular features. Groundwater Watch allows users to explore various views of data, including a graph showing the period of record, a daily data plot (showing the range of approved daily minimum and maximum data), and a graph showing recent measurements as compared to monthly statistics from the period of record.
The Hydrologic AnalySis Package (HASP) was created to replicate these graphics and statistics. Users can select a site and produce statistics and graphics on any USGS site of their choosing. Users can also produce hydrographs for entire aquifers using the Composite Workflows. HASP also allows users to produce some water-quality cross-plots. This package can be accessed via RStudio and interacted with through a clickable Shiny application and is described further here .
The NGWMN Data Portal allows access to interactive hydrographs and advanced statistics on individual site pages. This application serves data not available elsewhere on other USGS systems, representing data from over 37 contributing organizations.
What if I use another feature that was not listed above?
We acknowledge there might be additional functionality of Groundwater Watch that cannot easily be replicated in another product. We’re sorry. We hope to develop modernized software for the core Groundwater Watch functionality in the next several years. We will keep everyone informed as we work on the modernized software and publicize as new products and functionality are available.
Unprocessed groundwater level data are available on NWISweb ; this website is the best place to get our most recent, uninterpreted data. Users can search and download water-level data on Water Data for the Nation, or programmatically access these data via WaterServices . Users can interactively explore water-level data for individual sites on our Next- Generation Monitoring Location Pages .
Groundwater Watch alternatives:
Raw data feed consumption
Data access at thousands of sites
NGWMN Data Portal serves data from the National Groundwater Monitoring Network (NGWMN). This product serves site information, water-quality information, and water-level information, as well as a dot-map indicating the statistical condition of the most recent water-level measurement. More detailed statistical calculations and an interactive hydrograph are available on site pages.
A more limited number of USGS sites are available on this application due to sites needing to meet National Groundwater Monitoring Network criteria. The NGWMN statistics microservice has been tested to match the statistical calculations in Groundwater Watch; the color ramp used in this application also matches that used in Groundwater Watch.
Groundwater Watch alternatives:
Site Pages with Statistics and Graphics of Groundwater Conditions
Maps with symbols indicating recent conditions
Raw Data Feed Consumption
Downloading Statistics for Groundwater Levels
The Hydrologic AnalySis Package (HASP) is a USGS authored, peer-reviewed R package designed to create Groundwaer Watch-style graphs and statistics in the R environment. Data can be explored for a single site or group of sites in the same aquifer. If sites are classified in a national aquifer, HASP can produce statistics and graphics at the national-aquifer level. Plots can be generated in an R-Shiny application, which is user-friendly and allows users to click through the same site-specific or aquifer-specific graphics that would appear on Groundwater Watch. Users must have R and R Studio on their computers to access this package and associated R Shiny application.
Groundwater Watch alternatives:
Site Pages with Statistics and Graphics of Groundwater Conditions
Downloading Statistics for Groundwater Levels
The USGS National Water Dashboard (NWD) offers a groundwater-level layer that shows current conditions at about 1,800 instrumented and real-time sites nation-wide. The NWD map contains many of the same sites as the Groundwater Watch Real-Time Groundwater Level Network, but uses a different statistical method to generate percentile classes. Methodological improvement of percentile classes in the NWD will be a priority in FY23.
Groundwater Watch alternatives:
- Maps with symbols indicating recent conditions
The USGS VizLab team created a data visualization of U.S. Groundwater Conditions showing current conditions of wells with continuous data and at least three years of data available. Currently, this viz includes about 2,300 wells and the plans are to run the code to update this map quarterly.
Groundwater Watch alternatives:
Maps with symbols indicating recent conditions
National Animations of Groundwater Conditions
The Best Available Time Series (BATS) for Groundwater Levels was built to deliver a longer period of record for groundwater-level sites, combining both discrete and instrumented measurements into one service. This data source may be used to construct analyses and tools with a simpler data stream. Analyses using this service should be similar to those produced by Groundwater Watch.
Groundwater Watch alternatives:
- Raw Data Feed Consumption
What is the timeline?
We will turn this application off on September 1, 2022. After that, users will be directed to Water Data for the Nation from the legacy URL.
In future years, USGS Water plans to build out modernized software and tools to replace some unique Groundwater Watch functionality. Stay tuned to this blog for more information.
What if these suggestions don’t meet my needs?
We want to hear your feedback on how you access and use groundwater data. Please contact WDFN@usgs.gov with questions or to request more information on the products mentioned in this post.
Any use of trade, firm, or product names is for descriptive purposes only and does not imply endorsement by the U.S. Government.
Categories:
Related Posts
NWISWeb Decommission Campaign 3
July 31, 2026
This blog will share information on NWISWeb Decommission Campaign 3, which will retire all remaining NWISWeb pages and WaterServices. Campaign 3 is expected to be ongoing from November 2026 through February 2027 and is the last of three campaigns to decommission legacy NWISWeb pages currently hosted at https://waterdata.usgs.gov .
Modernized access for USGS rating curves is now available
April 28, 2026
Modernized access for USGS rating curves is now available
The USGS publishes rating curves describing the relationship between stage and streamflow at a monitoring location. Historically, these curves have been published at the NWISWeb Ratings Depot, available at https://waterdata.usgs.gov/nwisweb/get_ratings .
Updates and improvements to the National Water Dashboard
March 19, 2026
The National Water Dashboard (NWD) continues to evolve as we modernize our water-data delivery tools and improve how users discover, explore, and interact with real‑time information. Our latest set of updates focuses on simplifying the map experience, improving usability, adding new ways to customize your view, and continuing our long‑term transition away from legacy services. Below is an overview of what’s new.
WaterServices APIs will be decommissioned early 2027
January 7, 2026
We have released modernized Water Data APIs which will supersede the WaterServices family of APIs. WaterServices will be decommissioned in the first quarter of 2027. We will have more information about the decommission process, which may include intentional service degradation and blackouts, in the second half of 2026. We will not begin any intentional degradation of these services before August 2026.
Centralized Water Data in WDFN
December 23, 2025
Introduction
There have been a lot of changes to how you access USGS water data as we work to modernize data delivery in Water Data for the Nation (WDFN) and decommission NWISWeb. WDFN is no longer organizing data based on discipline specific landing pages (e.g., surface water, groundwater, water quality, and water use). WDFN also no longer provides a dedicated page displaying the data inventory or “summary of all available data” for each monitoring location as these features have been consolidated into modernized webpages. These changes will simplify our data delivery and enable all data collection categories to be found from the same pages and tools. This post will orient you to where to find the water data you need.