
Participate in the EFI-USGS River Chlorophyll Forecasting Challenge!
Submit to the river chlorophyll forecasting challenge, co-hosted by the USGS Water Mission Area and Ecological Forecasting Initiative.
We invite you to submit to the EFI-USGS River Chlorophyll Forecasting Challenge ! Co-hosted by the Ecological Forecasting Initiative (EFI) and U.S. Geological Survey (USGS) Proxies Project , this challenge provides a unique opportunity to forecast data from the USGS. By participating, you’ll sharpen your forecasting skills and contribute to vital research aimed at addressing pressing environmental concerns, such as harmful algal blooms (HABs) and water quality.
Why river chlorophyll?
Algal blooms cost the U.S. economy $2.2-4.6 billion dollars per year on average in water treatment and economic losses (Hudnell, 2010 ). Developing the capacity to predict when and where these blooms might occur could greatly reduce their impact. While much attention has been given to advancing predictive capabilities for algal blooms in lakes, river algal blooms can also cause substantial socio-ecological impacts, yet our understanding of their dynamics lags that of lakes. Fortunately, the number and diversity of observations that can be used to predict algal blooms are rapidly increasing (e.g., chlorophyll sensors), which enables powerful modeling techniques to extract patterns from these data and predict future HABs with sufficient lead time to initiate appropriate management interventions. Chlorophyll serves as a reliable proxy for algal biomass and can indicate when there might be an impending algal bloom. With this challenge, we hope to compare many different approaches for forecasting river chlorophyll to better understand the predictability of chlorophyll and potentially HABs in rivers across the United States.
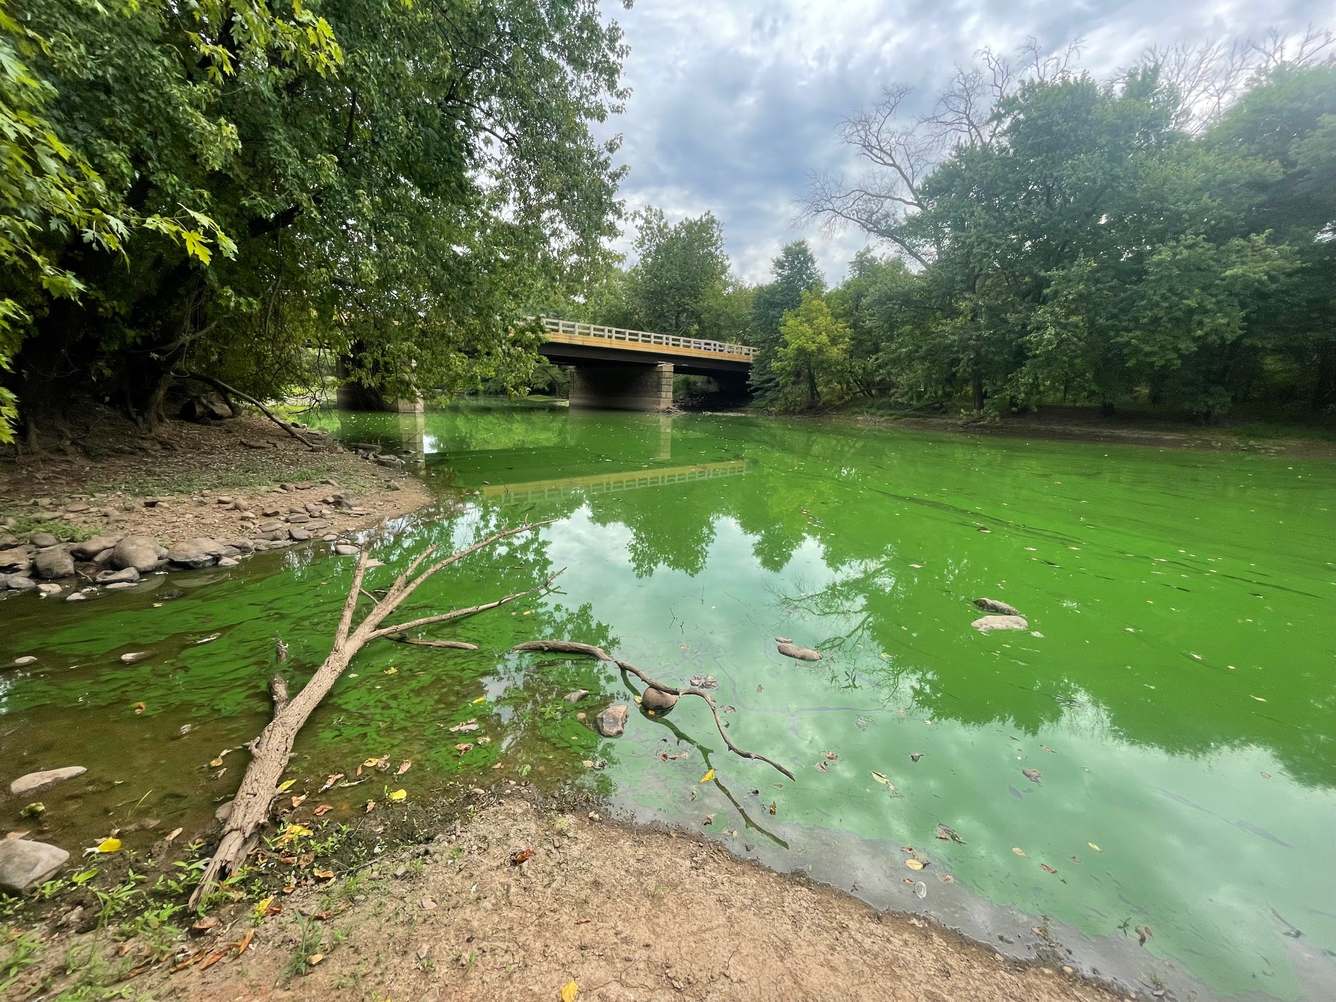
Looking upstream at a Harmful Algal Bloom filling the river on the Millstone River, New Jersey.
How can I get involved?
Getting involved is easy! Simply visit our EFI-USGS River Chlorophyll Forecast Challenge website to register and gain access to all the necessary resources and instructions. Whether you’re a seasoned researcher, a budding data scientist, or participating in a classroom project, there’s a place for you in this challenge. We provide step-by-step instructions, target data, numerical weather forecasts, and tutorials to empower you throughout the process. Plus, all forecasts and scores are publicly available, fostering transparency and collaboration within the community.
Who is organizing?
The Ecological Forecasting Initiative (EFI) is a grassroots consortium dedicated to building and supporting an interdisciplinary community of practice around near-term ecological forecasts. EFI has been running a separate forecast challenge since 2021, welcoming participants to forecast ecological data at National Ecological Observatory Network sites (Thomas et al. 2023 ). Building forecast models, generating forecasts, and updating these forecasts with new information requires a lot of data, and fortunately the USGS is largest provider of in-situ water information in the world. The USGS Proxies Project teamed up with EFI to select monitoring sites that fulfill the data requirements for a forecast challenge while also being strategically chosen based on their scientific, management, or social significance. Our EFI-USGS team is committed to advancing research in ecological forecasting and environmental modeling and your participation enhances this effort!
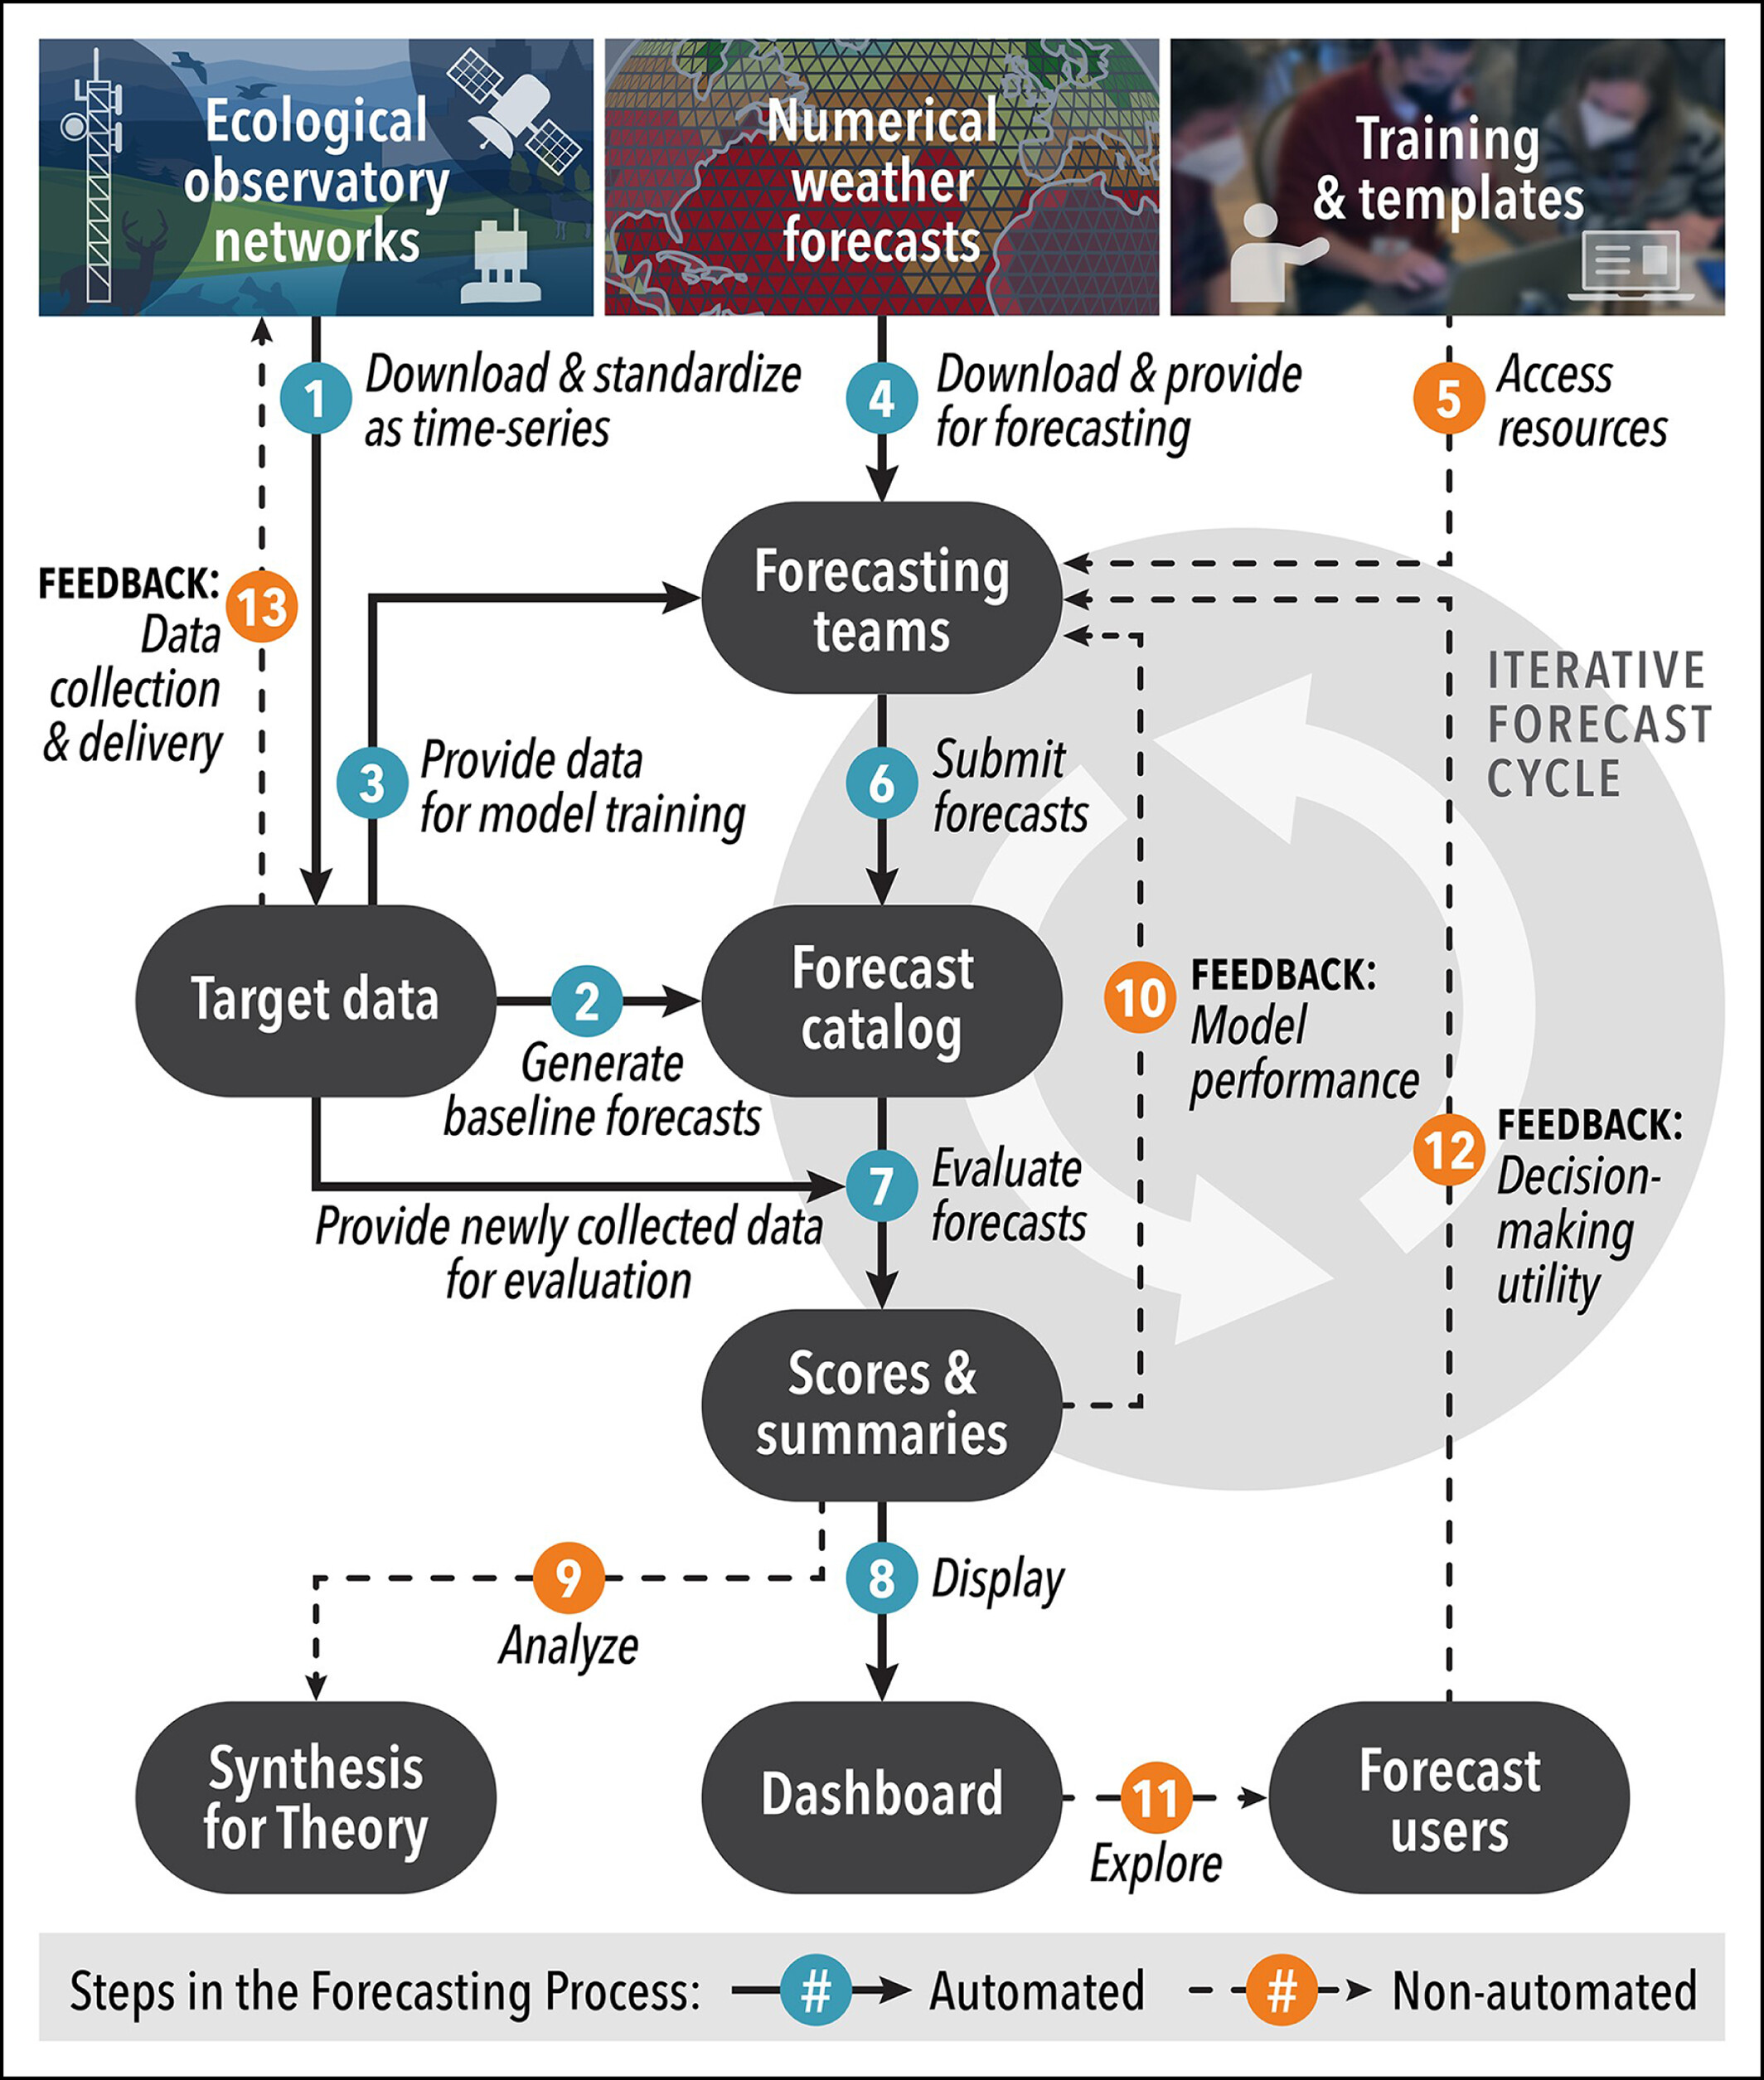
Workflow diagram for ecological forecasting challenges as developed by the Ecological Forecasting Initiative and described by Thomas et al. 2023 .
Are there any prizes or awards?
While there are no monetary rewards, the benefits of contributing are substantial. Participants can expect to advance their forecasting skills, find joy in tackling complex ecological problems, and potentially be involved in the creation of manuscripts based on their contributions. Our forecasting challenge serves as a platform for the ecological and data science communities to enhance their skills in forecasting ecological systems. By generating forecasts, participants contribute to a synthetic understanding of patterns of environmental predictability.
What if I have questions and will there be updates?
Have questions or need assistance? Feel free to reach out to Jacob Zwart at jzwart@usgs.gov for prompt support and guidance. Additionally, stay updated on the latest developments and announcements by visiting the EFI-USGS River Chlorophyll Forecast Challenge website . We’re here to ensure your experience in the challenge is smooth and rewarding, so don’t hesitate to reach out with any questions.
Categories:
Related Posts
USGS water data science in 2022
September 3, 2022
The USGS water data science branch in 2022
The USGS data science branch advances environmental sciences and water information delivery with data-intensive modeling, data workflows, visualizations, and analytics. A short summary of our history can be found in a prior blog post . Sometimes I refer to data scientists as experts in wrangling complex data and making it more valuable or usable. I’m writing this blog to update readers on the types of things we’re up to and point out some future changes (including new hiring efforts).
Large, parallel deep learning experiments using Snakemake
April 19, 2022
A paper we wrote was recently published! In the paper we had to run and evaluate many DL model runs. This post is all about how we automated these model runs and executed them in parallel using the workflow management software, Snakemake .
How we work on the Water Data for the Nation Team
March 9, 2021
The USGS Water Mission Area (WMA) is the largest provider of real time and historical water information in the world. A major part of our work in the WMA Web Communications Branch is to build modern web applications and APIs to make these data publicly available. We call our data delivery product line Water Data for the Nation (WDFN). Here’s our product vision:
Water Data Science in 2021
March 5, 2021
Where the USGS Water Data Science Branch is headed in 2021
It is an exciting time to be a data science practitioner in environmental science. In the last five years, we’ve seen massive data growth, modeling improvements, new more inclusive definitions of “impact” in science, and new jobs and duties. The title of “data scientist” has even been formally added as a job role by the federal government and there are all kinds of data science needs spelled out in the new USGS science plan .