
Improving Monitoring Pages with User Feedback
Improvements to next-generation monitoring pages in response to user feedback
User feedback is a vital part of our design process. We’ve asked users to provide feedback on our next-gen monitoring location pages and they’ve submitted some great ideas! Here are some things our users have asked for, and how we’ve responded to their requests:
Better map
Users asked us to improve the map in a few ways and we responded:
They requested a more detailed basemap, showing streets and landmarks. We swapped out the old basemap and replaced it with our very own USGS National Map . Users can now see details at the local level, including topography and local place names.
They asked us to show all monitoring locations in the field of view, not just other locations on the same stream. We now show all active monitoring locations nearby.
Another common request was to reduce the opacity of the upstream basin to make it easier to see features under the map layer. The upstream basin is now projected in a much lighter shade.
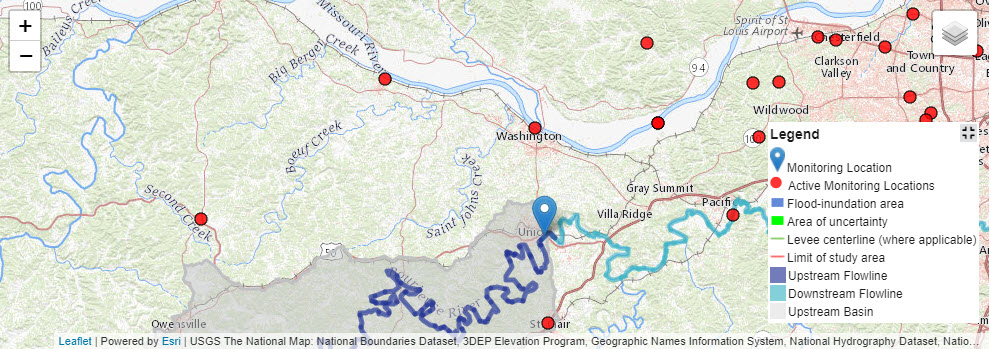
Screenshot of new improved basemap and upstream basin shading for montitoring location 07016500 , Bourbeuse River at Union, MO
Get a snapshot of what data are available at a site
Users wanted to know what data were available on which dates. We added a section to monitoring location pages that summarizes data availability for each site. The “Summary of All Available Data” section shows the start and end date of available data at each site. We grouped parameters into categories to make the available data easier to understand.

A screenshot of a data summary section from monitoring location 07019130 , Meramec River at Valley Park, MO
The period of record is also now displayed on the monitoring location pages for instantaneous values of each parameter, making it easier to request a custom time period to display on the hydrograph.
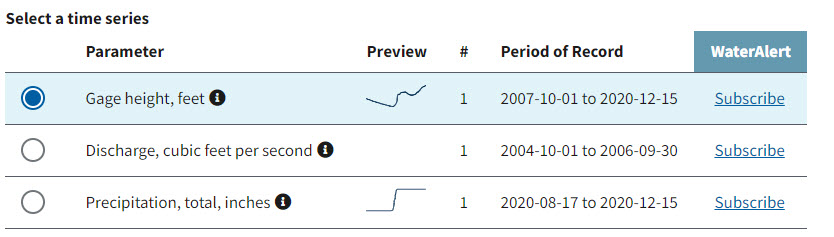
A screenshot showing the period of record for instantaneous values at monitoring location 07019130 , Meramec River at Valley Park, MO
Make the hydrograph easier to view and manipulate
- Users commonly asked for better ways to manipulate the timeline displayed on the hydrograph. Our team improved the ways users interact with dates by incorporating the U.S. Web Design System date picker in the “Custom” date section. Users can now select a custom date frame by choosing dates on a calendar or typing dates.
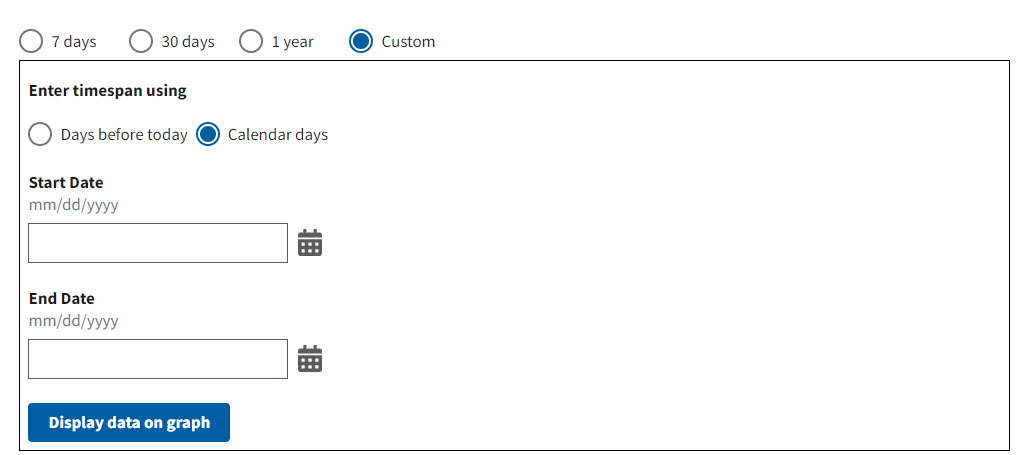
A screenshot of updated date picker for hydrograph display
They asked for easier ways to switch between parameters, especially on mobile devices. Our team changed the way that parameters are displayed on our pages by adding “radio buttons” so that it was easier for users to switch between parameters displayed on the hydrograph.
Users also asked that we take the parameter code number off the display so there is less text on the screen. We shortened the names of parameters displayed by moving the USGS parameter codes (commonly referred to as “p-codes”) into tool tips, which users access by hovering over the icon at the end of the parameter name.
Example of how to switch between parameters at monitoring location 09405500 , North Fork Virgin River near Springdale, UT
- Others requested that we switch the colors on the hydrograph so that historic and statistical data are easier to view. Our team made these changes and also improved how the hydrograph looks on the page. We changed the color and thickness of median data and historic data so that they are easier to view.
Add links to other USGS services
- Users asked us to add links to make our other services more accessible to them. Our team responded by adding links to WaterAlert for parameters of interest at the top of the menu/table where users also see the period of record. These links take users directly to a subscription form for the site where they set notification thresholds.
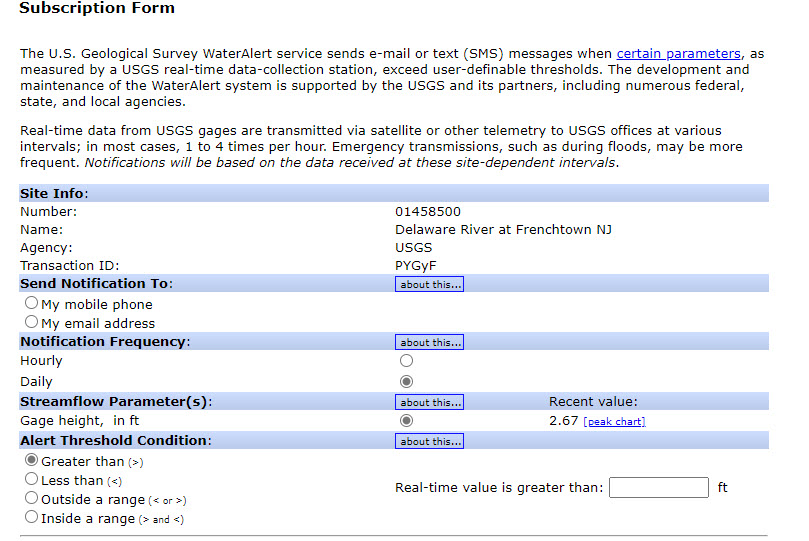
Example of WaterAlert Subscription Form for monitoring locaiton 01458500 , Delaware River at Frenchtown, NJ
- Users wanted to be able to download data. We added links to different methods for downloading data. These links point to data available from USGS Water Data Services and are limited to instantaneous data available in the hydrograph. We also encourage users to use the dataRetrieval package in R, which allows users to access an expanded data set for each site.
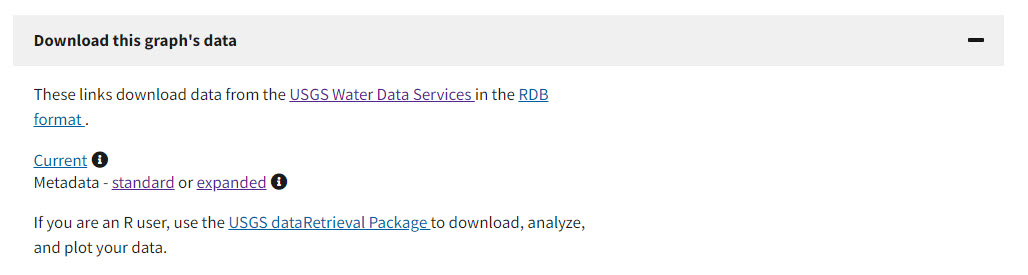
Screen capture of data download section
Related Posts
Spring 2021 Water Data for the Nation release notes
April 16, 2021
What have we been up to? Adding temperature in Fahrenheit Updating user feedback options Making WDFN more usable New features and tools Temperature available in Fahrenheit Historically, USGS has taken temperature data in degrees Celsius.
#5NewThings
August 21, 2020
The Water Resources Mission Area is spotlighting five newly available features on our next-gen monitoring location pages this week! To compliment this blog post, we will show off our work on Instagram and Twitter, using the hashtag #5NewThings.
Water Quality Data Delivery Listening Sessions
July 28, 2020
Water Quality Data Delivery Listening Sessions Starting on August 3, 2020, the WDFN Team will be conducting a month of activities aimed at gathering input from both internal and external users to help guide development activities related to water-quality data delivery.
Decommissioning of the National Water Census - Data Portal
July 22, 2020
What are you decommissioning? As the USGS Water Mission Area (WMA) undertakes modernizing data delivery as part of implementation of the U.S. Geological Survey Water Science Strategy (Circular 1382-G ), resources will be directed away from legacy applications to new development and delivery mechanisms.
Release Notes for July 21st, 2020
July 21, 2020
What have we been up to? Pubs Warehouse moved to the Cloud Behind the scenes work New features and tools Pubs Warehouse on the Cloud The Water Data for the Nation team is the primary development team for another high profile application, the USGS Publications Warehouse .