
Beyond Basic R - Introduction and Best Practices
Brief introduction to the series of posts about next steps after learning basic R, plus some tips on best practices for scripting in R.
We queried more than 60 people who have taken the USGS Introduction to R class over the last two years to understand what other skills and techniques are desired, but not covered in the course. Though many people have asked for an intermediate level class, we believe that many of the skills could be best taught through existing online materials. Instead of creating a stand-alone course, we invested our time into compiling the results of the survey, creating short examples, and linking to the necessary resources within a series of posts. This is the first in a series of 5 posts called Beyond basic R.
Other posts that will be released during the next month include:
- Data munging
- Plotting with ggplot2 and setting custom themes
- Mapping
- Version control via Git
You can see all posts in this series by clicking the tag “Beyond Basic R” or follow this link .
Best practices for writing reproducible R scripts
Scripting can significantly increase your ability to create reproducible results, figures, or reports so that both your collaborators and future self can successfully rerun code and get the same results. However, just because you’ve put code into a script doesn’t make it reproducible. There are some general organization and code writing tips that can elevate your scripts into reproducible code.
Code organization
- Put all
library()calls and any hard-coded variables at the top of the script. This makes package dependencies and variables that need to be changed very apparent. - Use RStudio projects to organize your scripts, data, and output. Add scripts to your RStudio project inside a subfolder called
R,src, or something similar. Make sure you have separate folders for data inputs, data outputs, plots, and reports (e.g. R Markdown). All of these folders help keep content in a project organized so that others can find what they need. When you share an RStudio project or go between computers, R knows to interpret file paths relative to the project folder – no more changing working directories! However, having all your RMarkdown files in a different subfolder from data means you might need to use..in your file path to go “up” a level, e.g.../input/mydata.csv. Learn more about RStudio projects here and see an example of an RStudio project setup here . - Modularize your code. One script that has hundreds of lines of code can be challenging to maintain and troubleshoot. Instead, you should separate your analysis into multiple “modules” at logical points. Then, you can use
sourceto execute the contents of each module. When you separate your workflow into multiple scripts, it is useful to name them in ways that indicate the order in which they should be used, e.g.1_fetch_data.R,7_plot_data.R, etc. Modules are useful as actual scripts, but modularized workflows could also be a collection of user-defined functions (or a mixture of both). You can learn the basics about functions in the USGS Introduction to R material and find advanced information about functions in Hadley Wickham’s Advanced R tutorial . - Do not save your working directory. When you exit R/RStudio, you probably get a prompt about saving your workspace image - don’t do this! The very nature of reproducible workflows is that you can reproduce your results by re-running your scripts. For this reason, there is no need to save your working directory - you can get all of your variables back by re-running your code the next time you open R. You can learn more about why this is not a great practice from a lesson by Jenny Bryan and a post by Martin Johnsson . You can turn off this prompt so that you are not tempted by going to Tools > Global Options and clicking “Never” in the dropdown next to “Save workspace to .RData on exit”.
Code itself
- Use
library()NOTrequire()when loading packages in scripts.librarywill throw an error if it the library is not already installed, butrequirewill silently fail. This means you get a mysterious failure later on when functions within a package are not available and you thought they were. Learn more about this in Yihui Xie’s blog post . - Do not use functions that change someone’s computer (e.g. install.packages, or setwd). Jenny Bryan has a great blog about the pitfalls of creating code that is not self-contained.
- Comment incessantly. Comments should not take the place of clean and clear code, but can help explain why you might have done certain steps or used certain functions. Commenting is just as important for you as it is for any one else reading your code - as they say, your worst collaborator is you from 6 months ago. Learn a few more tricks with commenting and organizing code that RStudio offers here .
- Follow a style and be consistent. There is no single correct way to style your code, but the important part is that you are consistent. Consistent style makes your code more readable, which makes collaboration with others and the future you much easier. When we talk about style, we are talking about how you name variables, functions, or files (camelCase, under_scores, etc) and how your code is visually organized (e.g. how long a single line can span, where you indent, etc). You can choose your own style guide, but this style guide from Google
and this one from tidyverse
are good places to start. When it comes to visual organization, RStudio has auto-indent features that help make it easier for you to put your code in the right place, and you can always force the RStudio indent by highlighting code and using
CTRL + I. - As you are writing your code, take advantage of RStudio’s autocomplete features (and/or copy/paste). Typing mistakes are often a reason that code doesn’t work (e.g. a lowercase letter that really should have been uppercase), and using auto-complete or copy/paste reduces the prevalence of these mistakes. To use auto-complete, start typing something and hit the
Tabbutton on your keyboard. You should see options start to pop up. More about auto-complete features here . - Learn to use loops or functions when you find yourself copying and pasting chunks of code with only minor changes. More code means more to maintain and troubleshoot, so try to reuse code via loops and functions when possible. Consider this tutorial from Nice R Code , the USGS Introduction to R lesson on R programming structures , or the Software Carpentry loop tutorial to learn more.
This is a brief list of good practices to consider when writing R code, and there are lots of other resources to reference when it comes to “best practices”. You should take a look at other posts to get an idea of what the R community thinks more broadly. To start, you could reference Best Practices for Writing R by Software Carpentry or Efficient R programming by Colin Gillespie and Robin Lovelace. As you explore suggested practices online, keep in mind that R is open-source software and is constantly evolving which means best practices will evolve, too.
Disclaimer
Any use of trade, firm, or product names is for descriptive purposes only and does not imply endorsement by the U.S. Government.
Categories:
Related Posts
Beyond Basic R - Version Control with Git
August 24, 2018
Depending on how new you are to software development and/or R programming, you may have heard people mention version control, Git, or GitHub. Version control refers to the idea of tracking changes to files through time and various contributors. Git is an example of a version control tool, and GitHub is a popular web interface for Git. That’s it. Easy!
Beyond Basic R - Mapping
August 16, 2018
Introduction
There are many different R packages for dealing with spatial data. The main distinctions between them involve the types of data they work with — raster or vector — and the sophistication of the analyses they can do. Raster data can be thought of as pixels, similar to an image, while vector data consists of points, lines, or polygons. Spatial data manipulation can be quite complex, but creating some basic plots can be done with just a few commands. In this post, we will show simple examples of raster and vector spatial data for plotting a watershed and gage locations, and link to some other more complex examples.
Beyond Basic R - Plotting with ggplot2 and Multiple Plots in One Figure
August 9, 2018
R can create almost any plot imaginable and as with most things in R if you don’t know where to start, try Google. The Introduction to R curriculum summarizes some of the most used plots, but cannot begin to expose people to the breadth of plot options that exist.There are existing resources that are great references for plotting in R:
Beyond Basic R - Data Munging
August 1, 2018
What we couldn’t cover
In the data cleaning portion of our Intro to R class , we cover a variety of common data manipulation tasks. Most of these were achieved using the package
dplyr, including removing or retaining certain columns (select), filtering out rows by column condition (filter), creating new columns (mutate), renaming columns (rename), grouping data by categorical variables (group_by), and summarizing data (summarize).A map that glows with the vocabulary of water
February 27, 2026
English is the official language and authoritative version of all federal information.
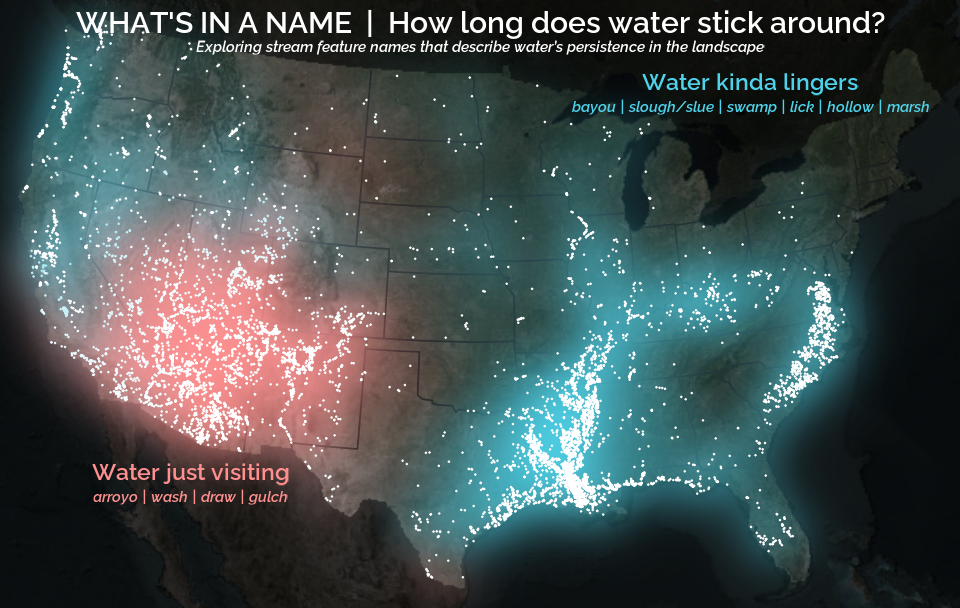
A map that glows with the vocabulary of water
What is your first impression of the map above? To me, it is the shimmer. Thousands of points of light, each one a stream or river, illuminating a darkened basemap. Look closely and a pattern emerges: the country’s waterways form a linguistic constellation. These points are classified not from population data or even explicitly by hydrology. They glow strictly according to the vocabulary used to name them and what can be implied about the hydrology of these streams based on their names.