
Keywords: data visualization
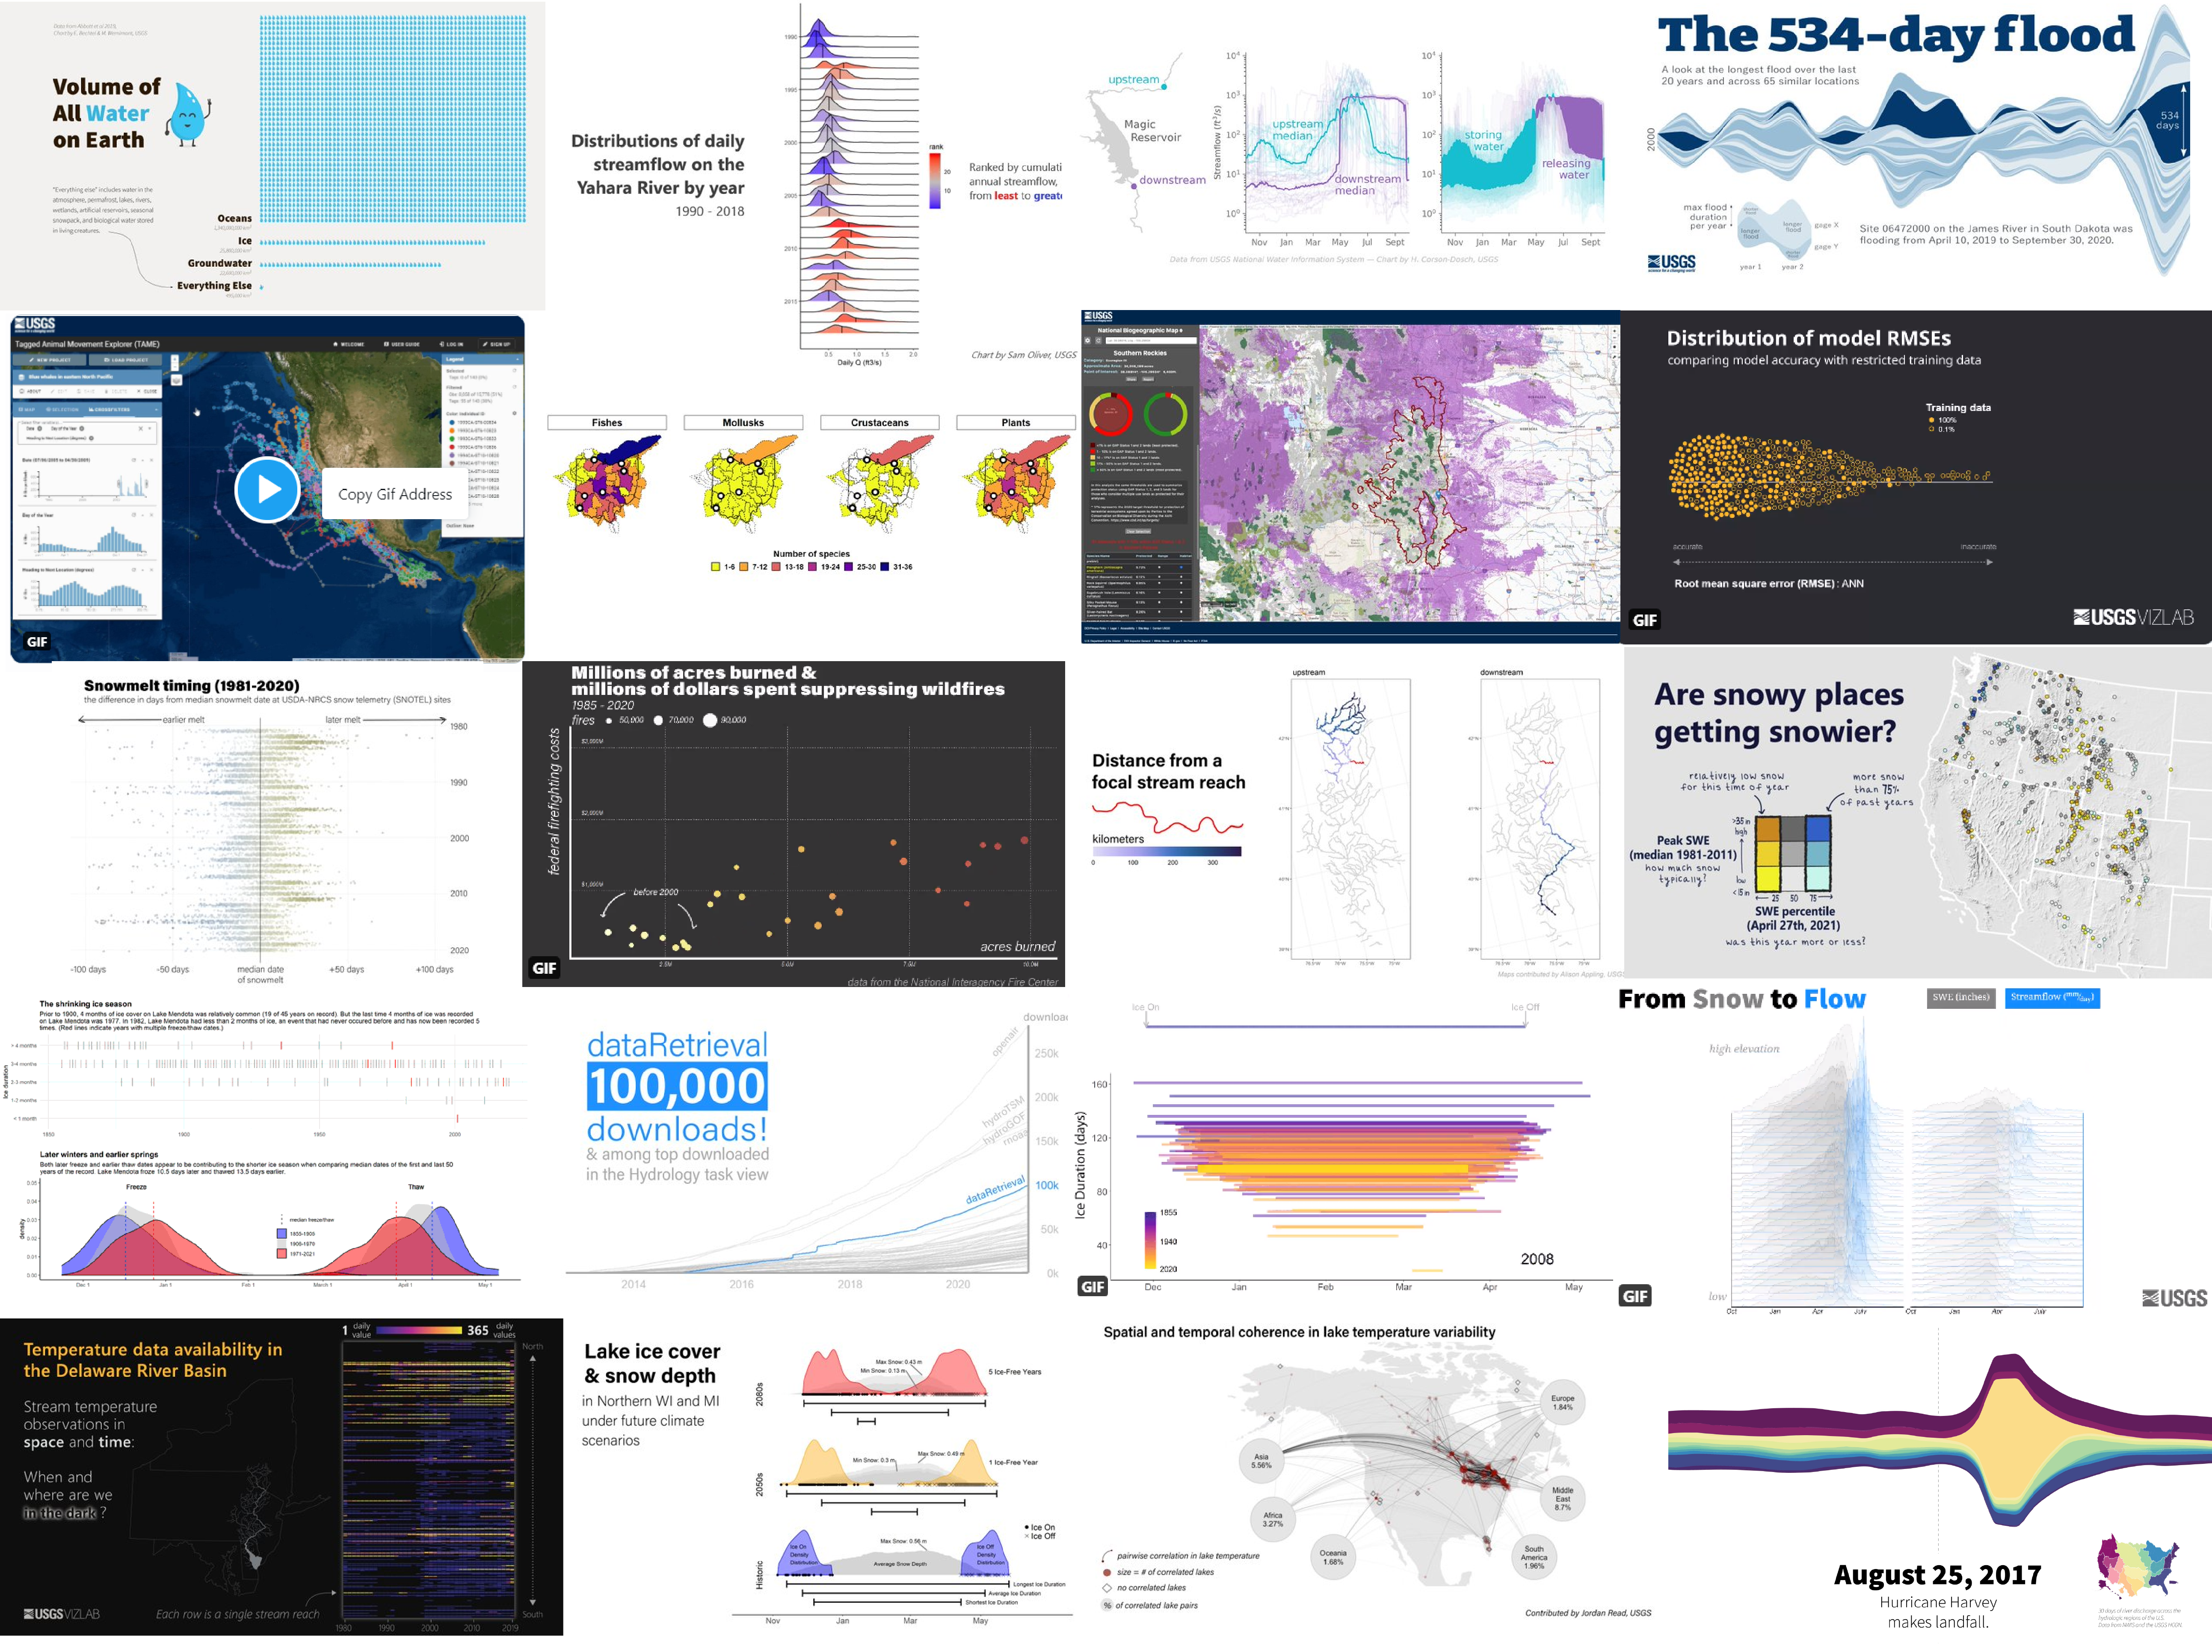
A collection of data viz for the 2023 30 Day Chart Challenge

Reflections on my time as a data science manager in the U.S. Geological Survey

USGS Water Mission Area 2022 Supervisory Cluster Hires


Use R to generate a video and gif similar to the Vizlab animation series, U.S. River Conditions.
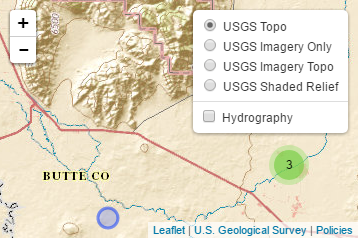
Integrate The National Map services within your own interactive web map using Leaflet for R.