Iterate your R code using the map() function from the purrr package.
Official websites use .gov
A .gov website belongs to an official government organization in the
United States.
Secure .gov websites use HTTPS
A lock (
) or https:// means you’ve safely connected to the .gov website. Share
sensitive information only on official, secure websites.
Iterate your R code using the map() function from the purrr package.
Write functions in R that run better and are easier to understand.
Learn the ropes building your own functions in R using water data examples.
A pipeline-based approach for making large data pulls from Water Quality Portal
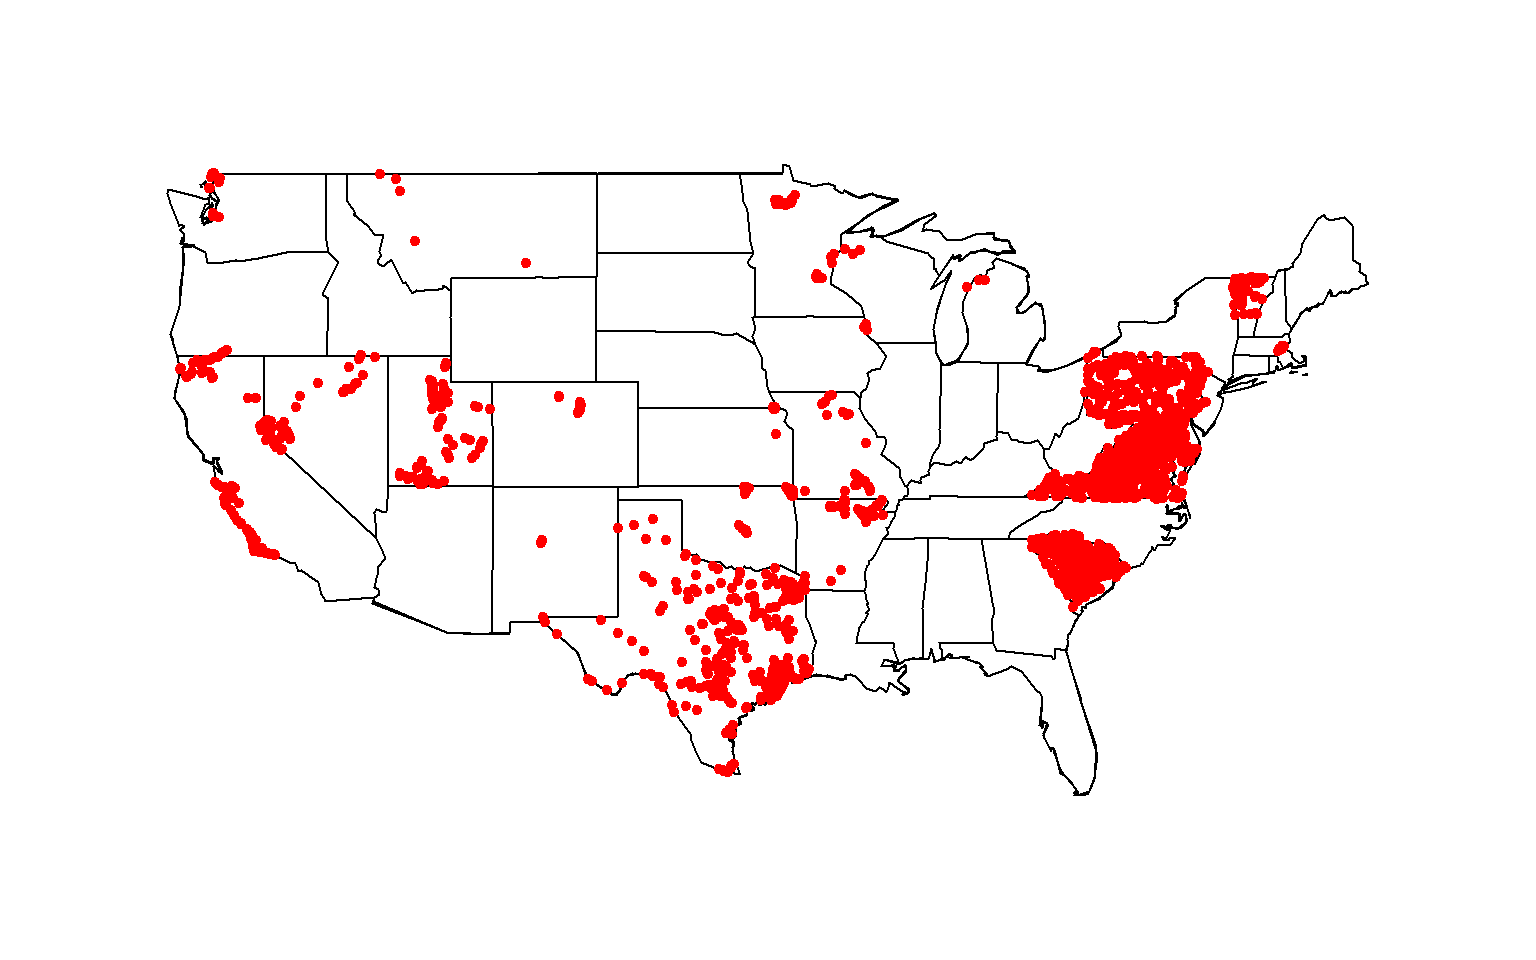
Large pull for all total nitrogen data for streams in the contiguous United States with sites that have at least 40 measurements between 1995 and 2020.
Basic dataRetrieval tutorial for USGS water data in R.
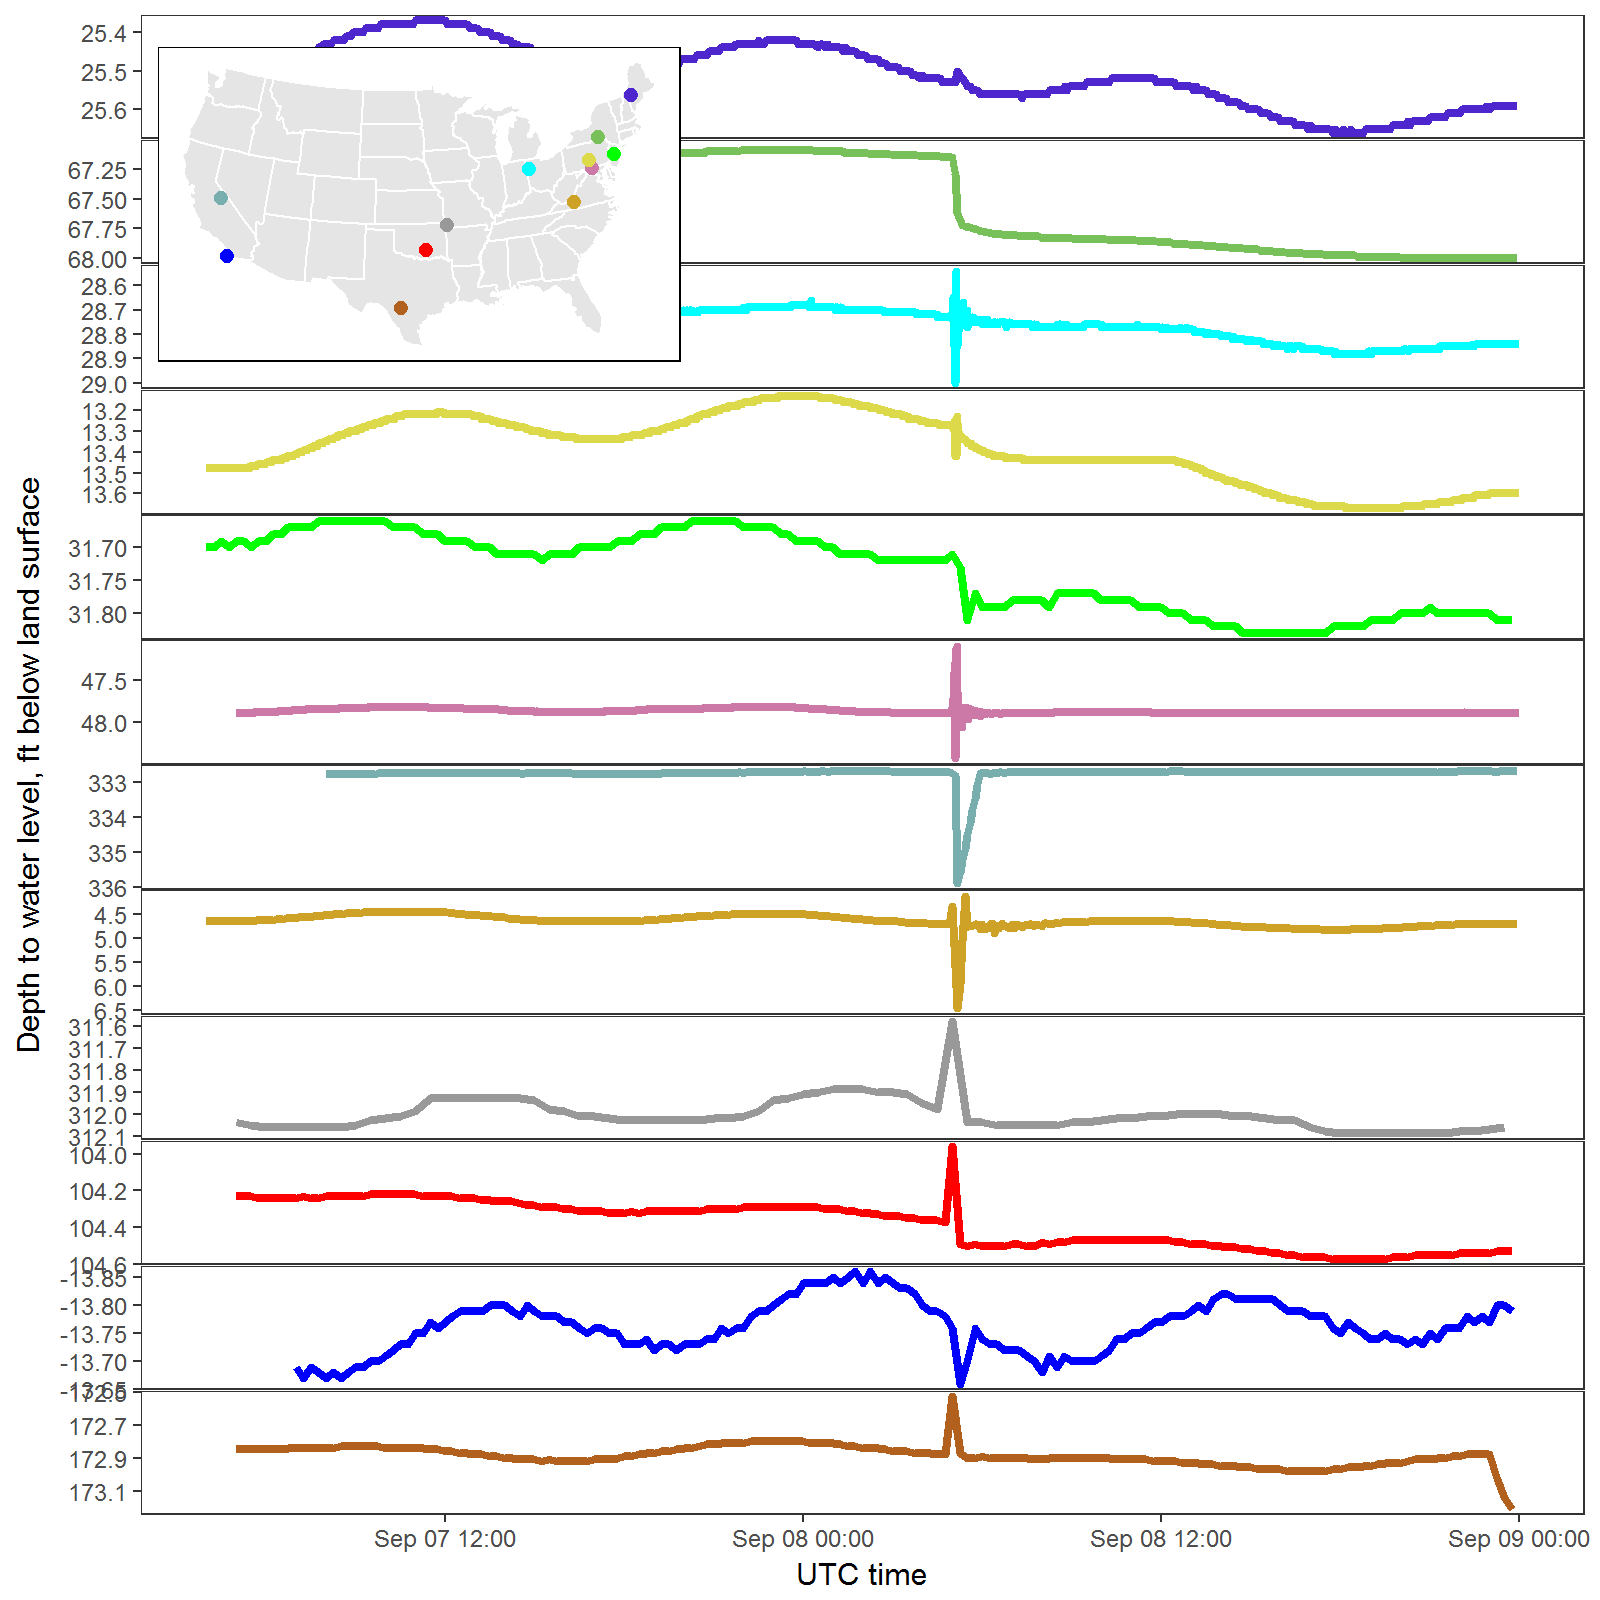
Using ggplot2 to inspect water levels affected by earthquake.
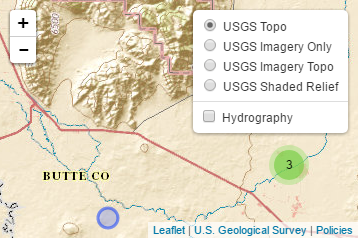
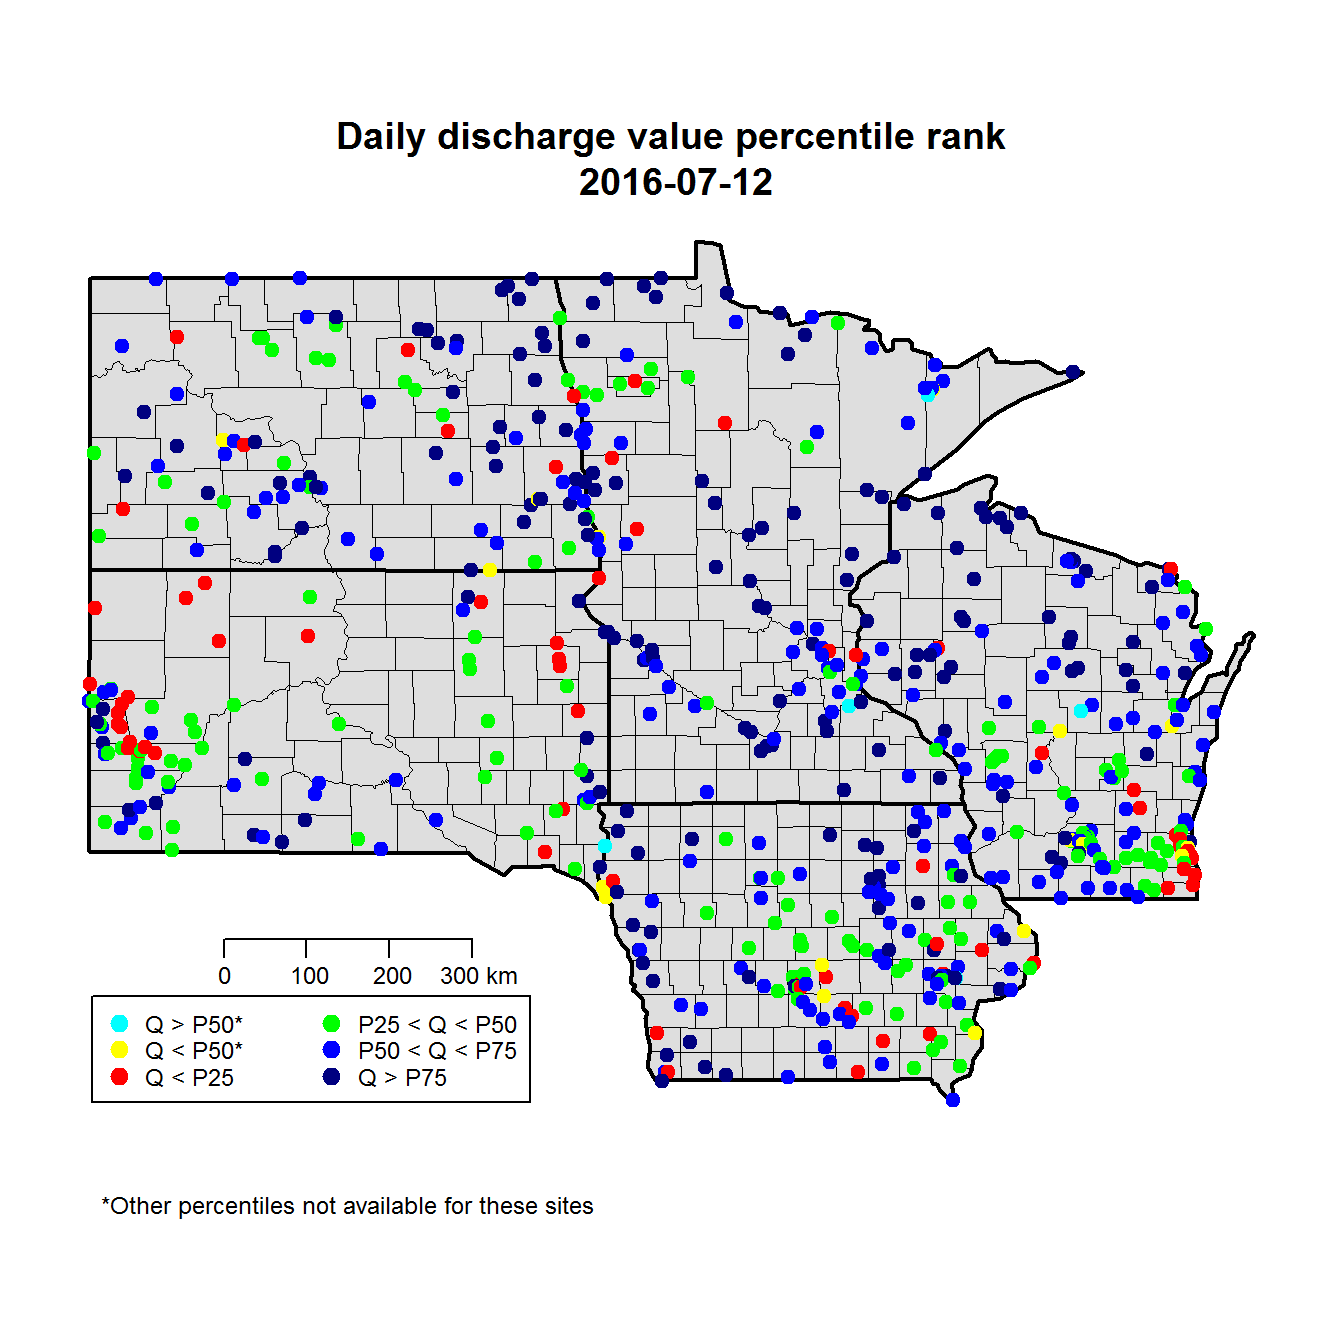
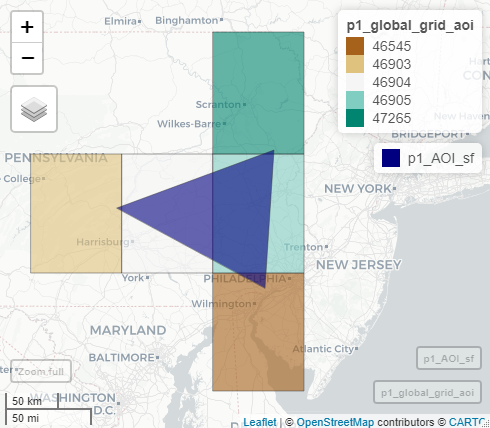
Integrate The National Map services within your own interactive web map using Leaflet for R.
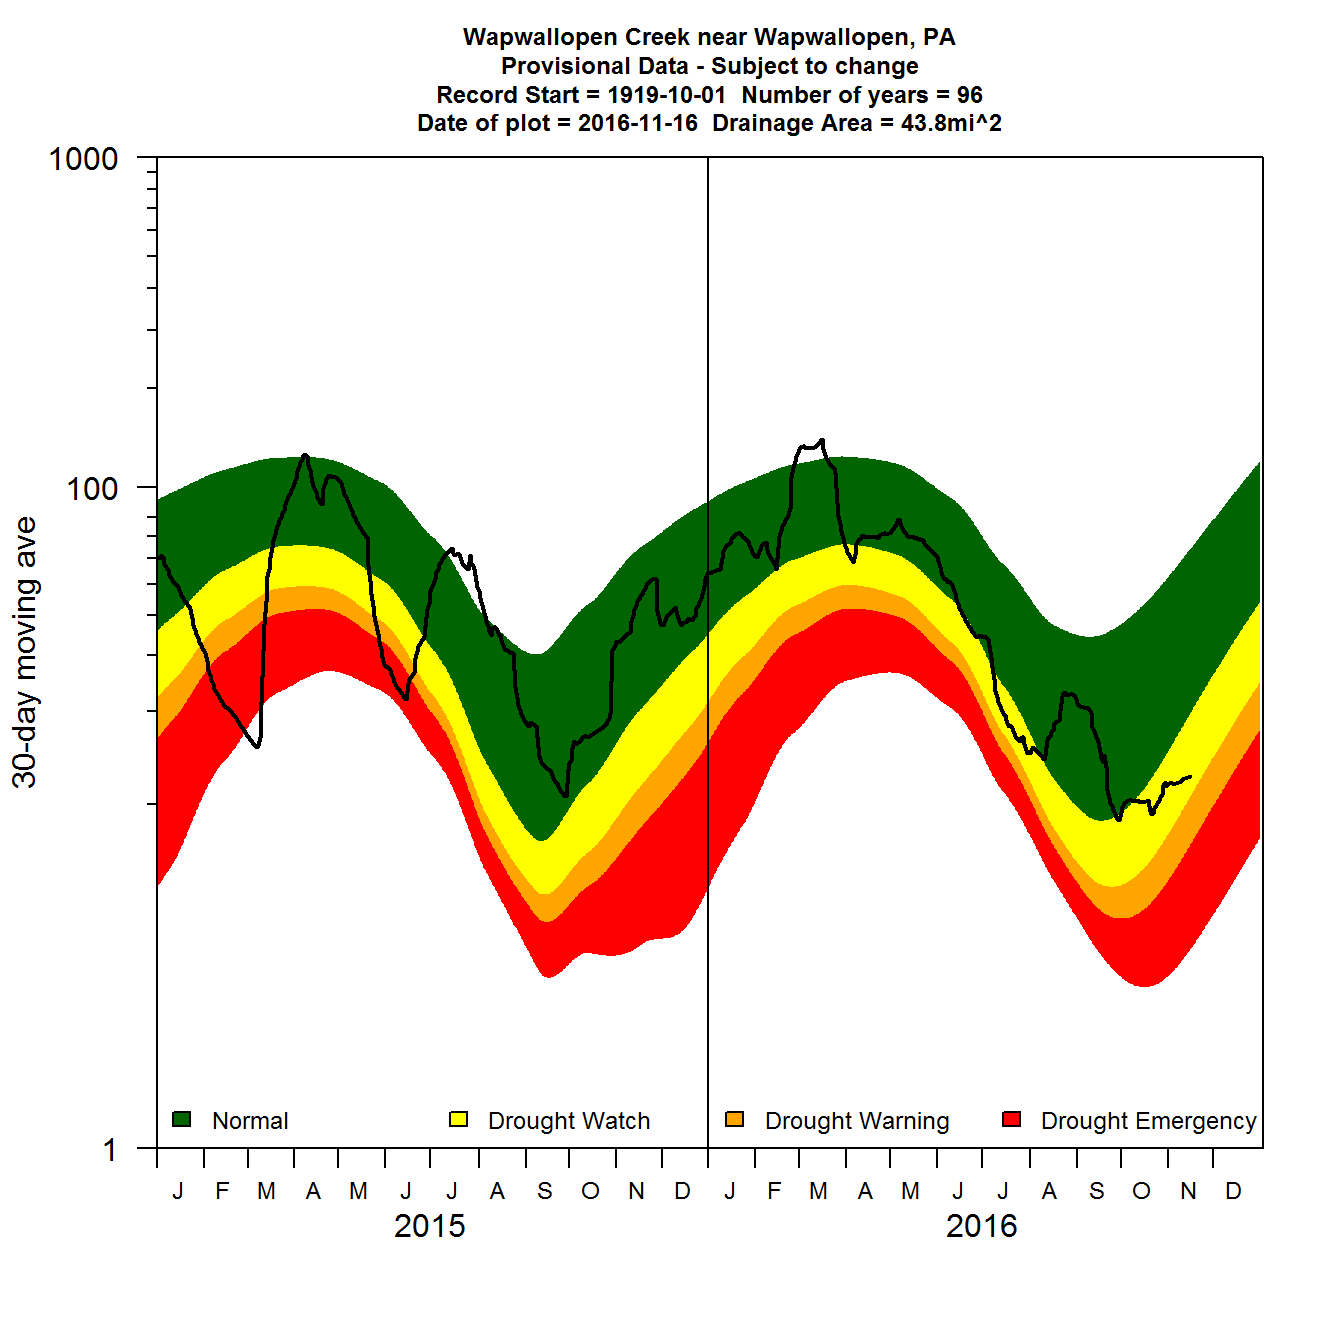
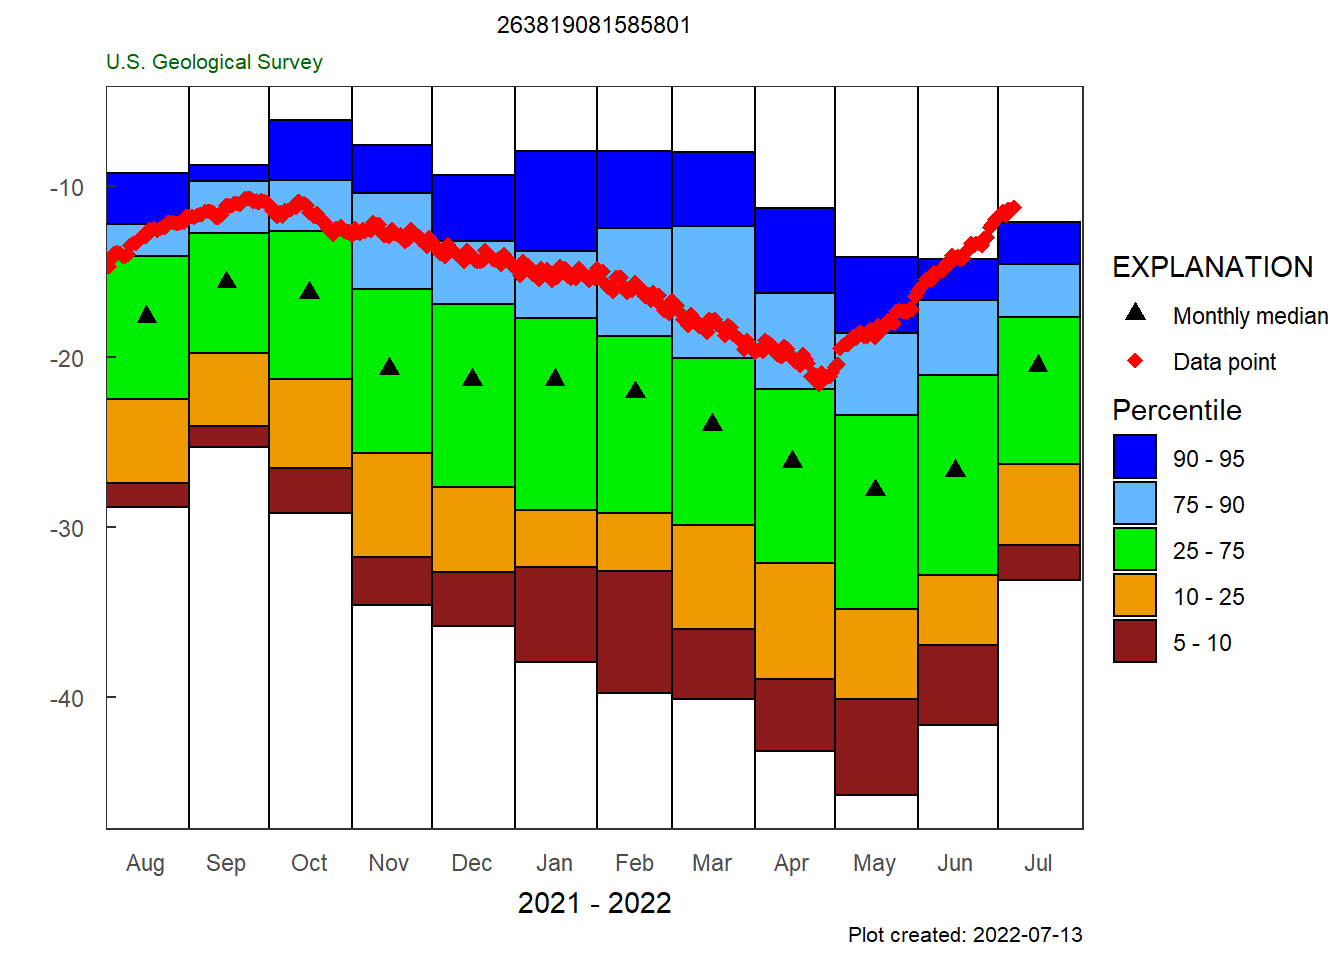
Using the R-packages dataRetrieval, dplyr, and ggplot2, a simple discription on how to create a moving-average plot with historical flow quantiles.
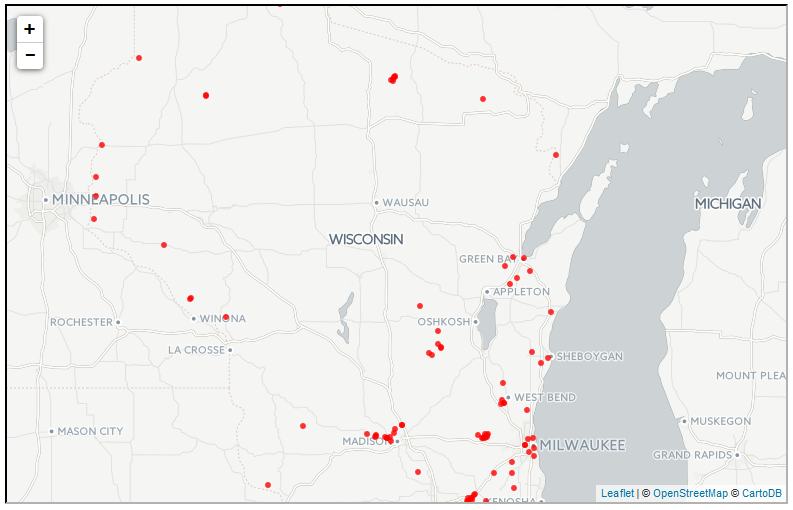
Using the R packages dataRetrieval, leaflet, and htmlwidgets, the workflow for a Hugo page is explained.