
This blog shows several different ways to visualize data from the tidycensus package for R.
Official websites use .gov
A .gov website belongs to an official government organization in the
United States.
Secure .gov websites use HTTPS
A lock (
) or https:// means you’ve safely connected to the .gov website. Share
sensitive information only on official, secure websites.
This blog shows several different ways to visualize data from the tidycensus package for R.
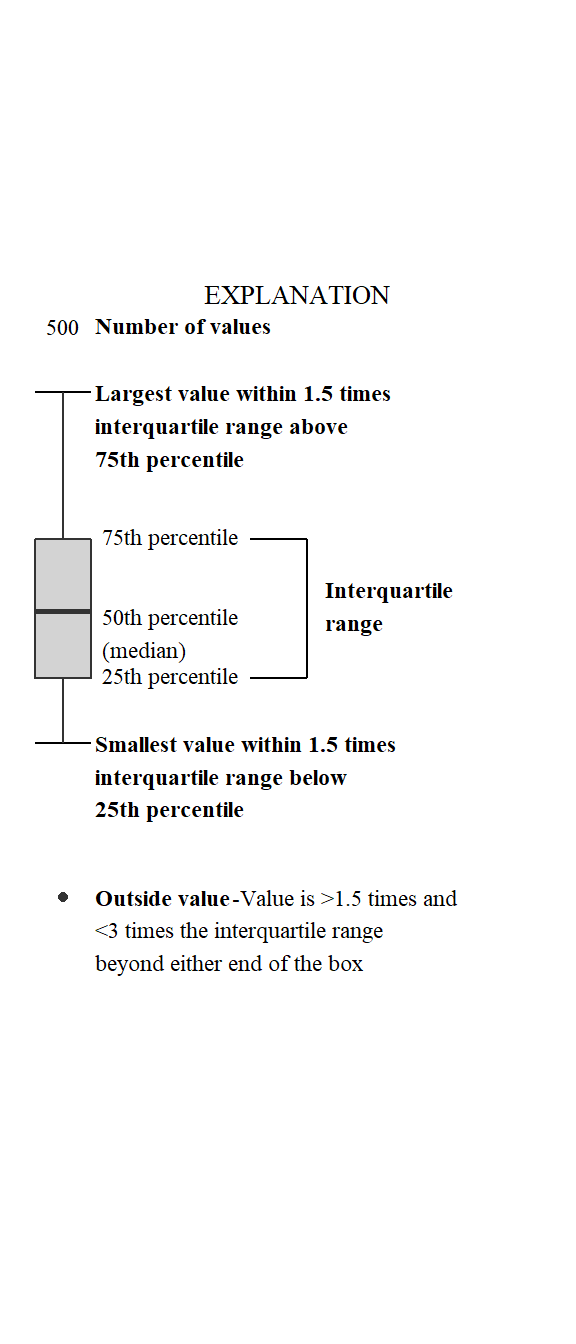
Identifying boxplot limits and styles in ggplot2.

Resources for plotting, plus short examples for using ggplot2 for common use-cases and adding USGS style.