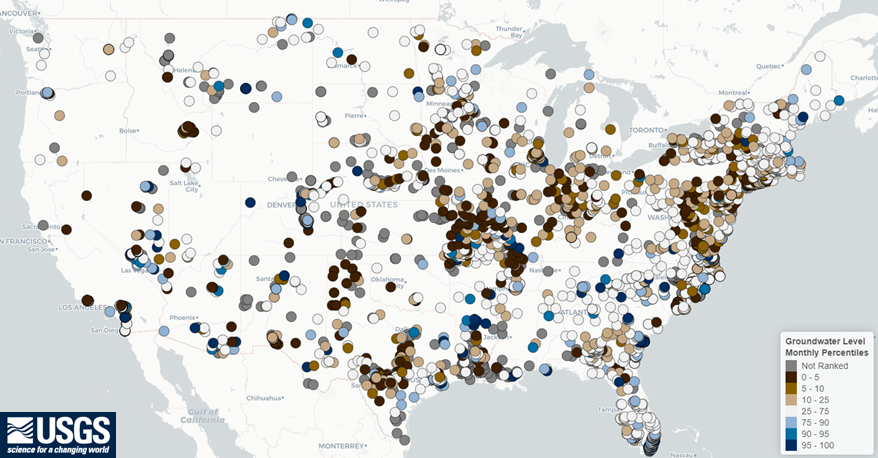
A new, experimental application for viewing groundwater levels with historical context and for generating site-level reports.
Official websites use .gov
A .gov website belongs to an official government organization in the
United States.
Secure .gov websites use HTTPS
A lock (
) or https:// means you’ve safely connected to the .gov website. Share
sensitive information only on official, secure websites.
A new, experimental application for viewing groundwater levels with historical context and for generating site-level reports.
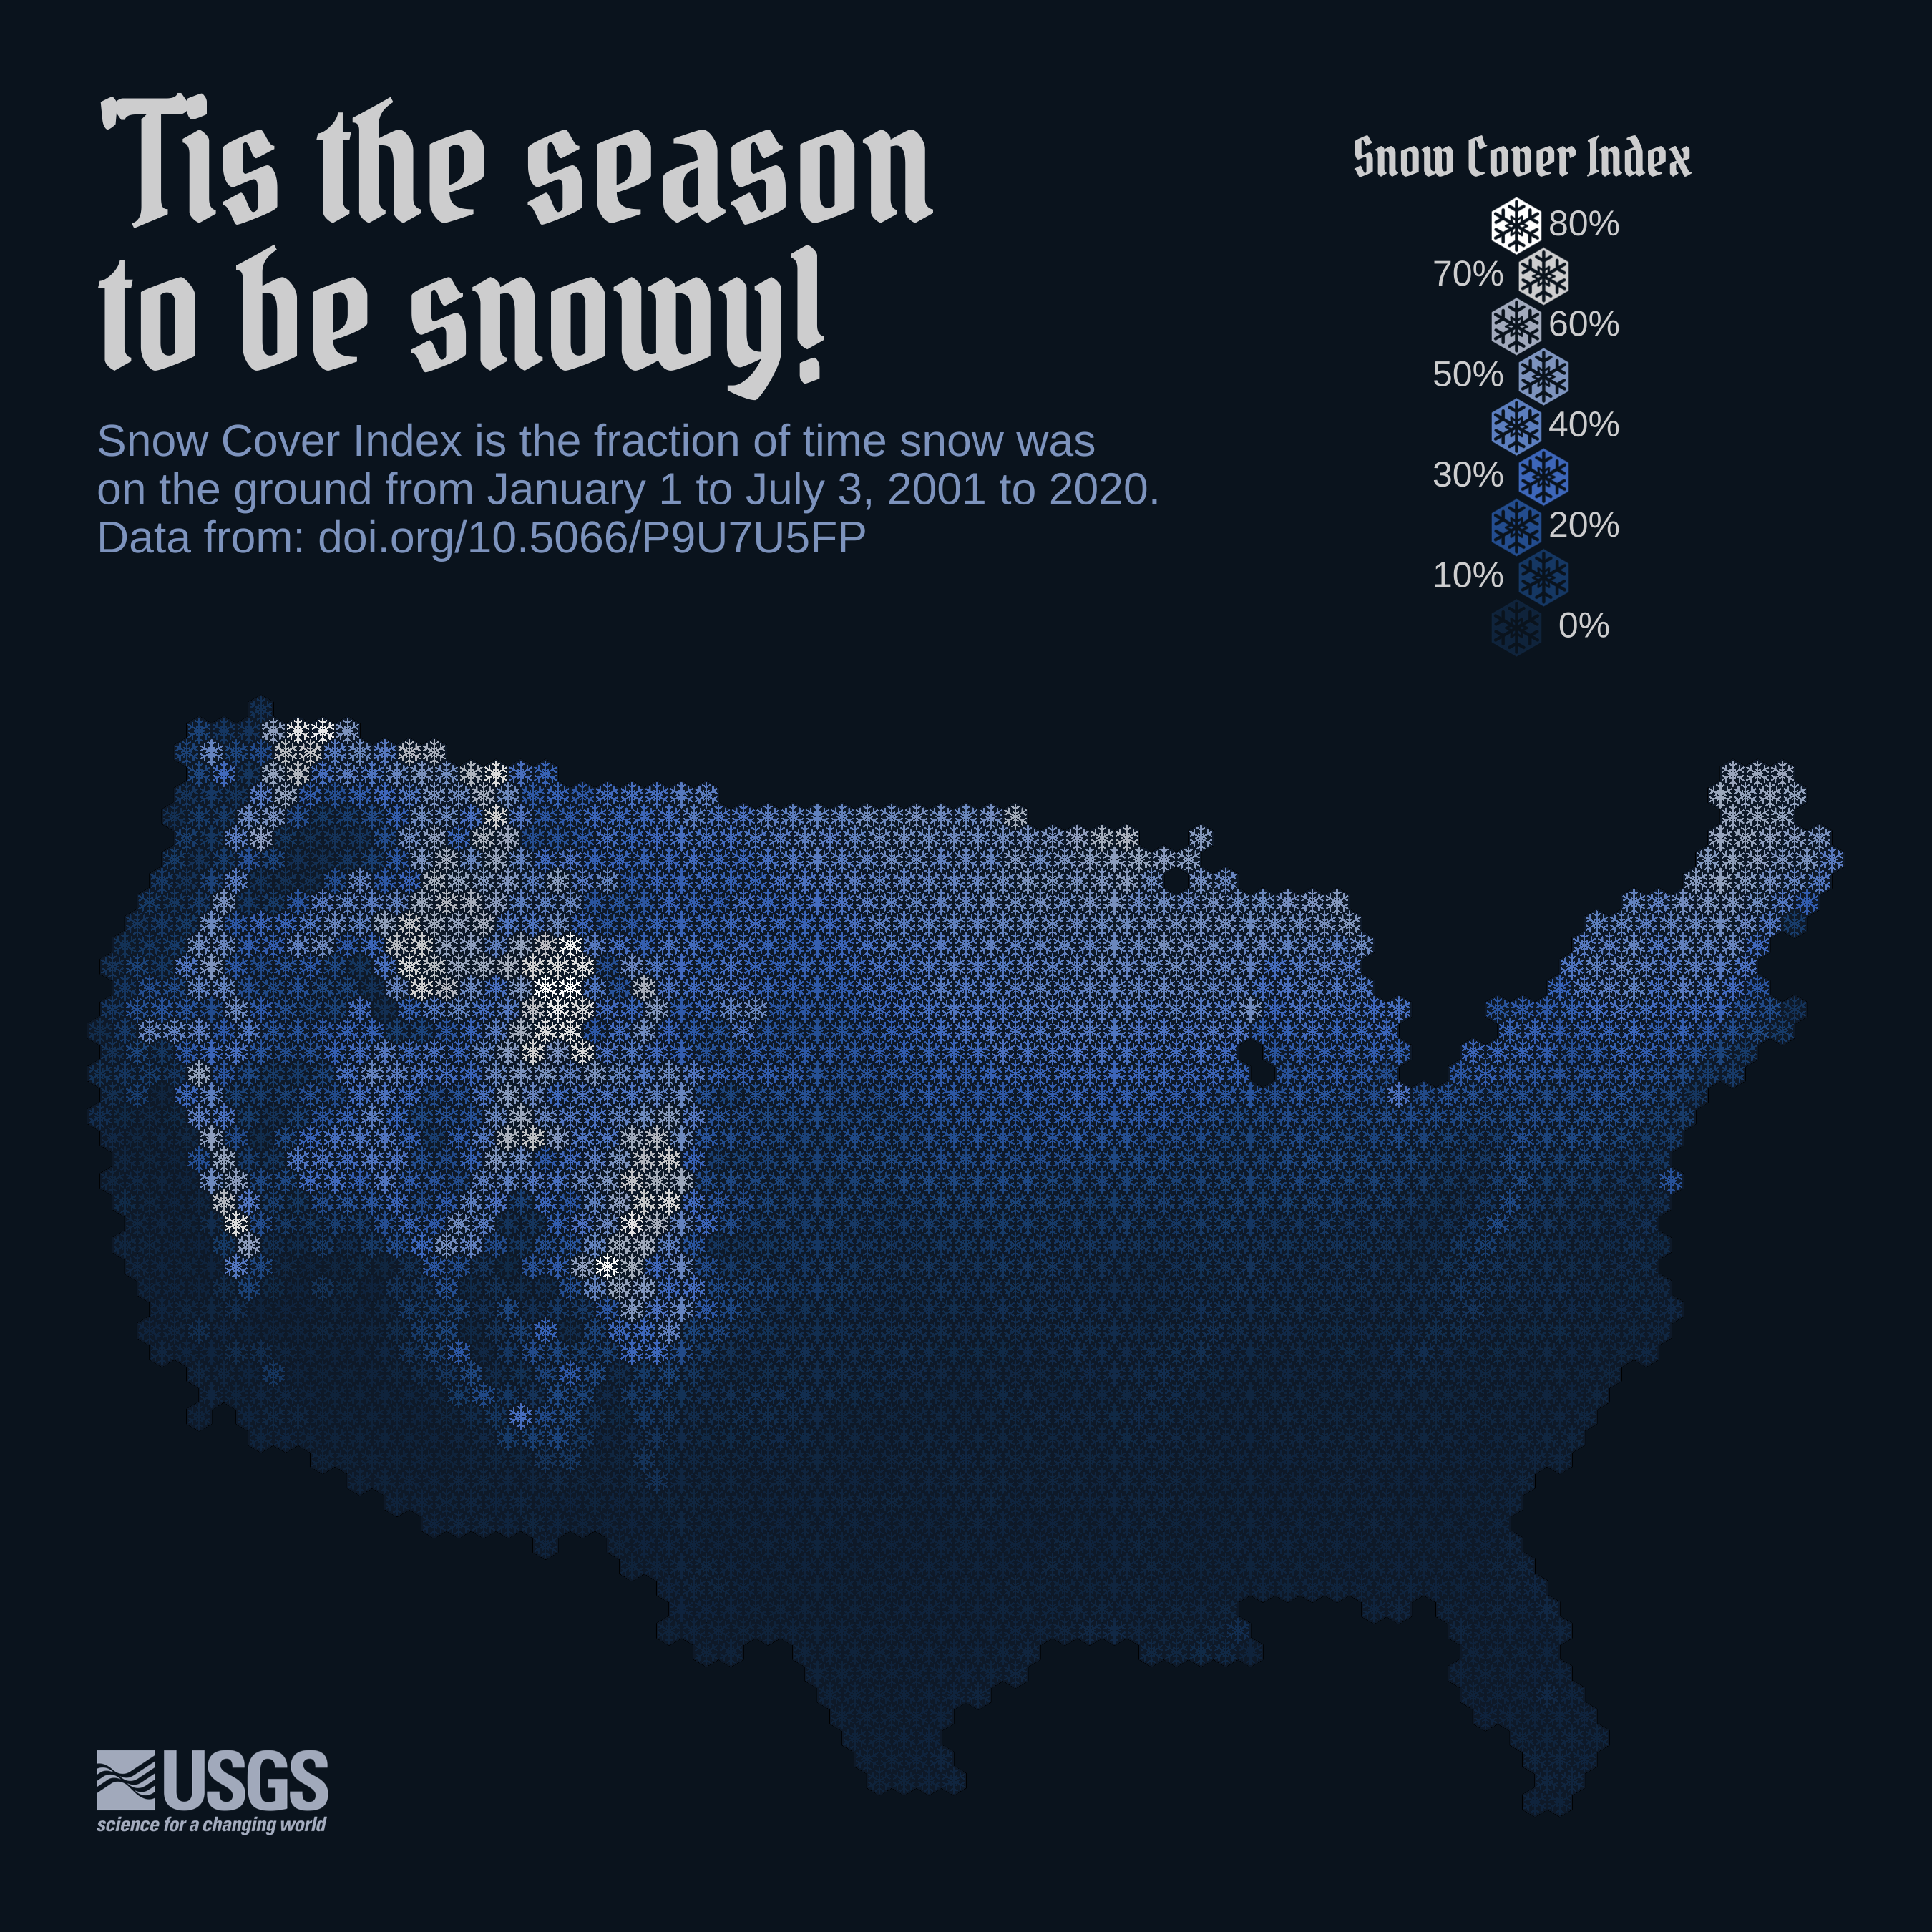
Reproducible code demonstrating the evolution of a recent data viz of CONUS snow cover
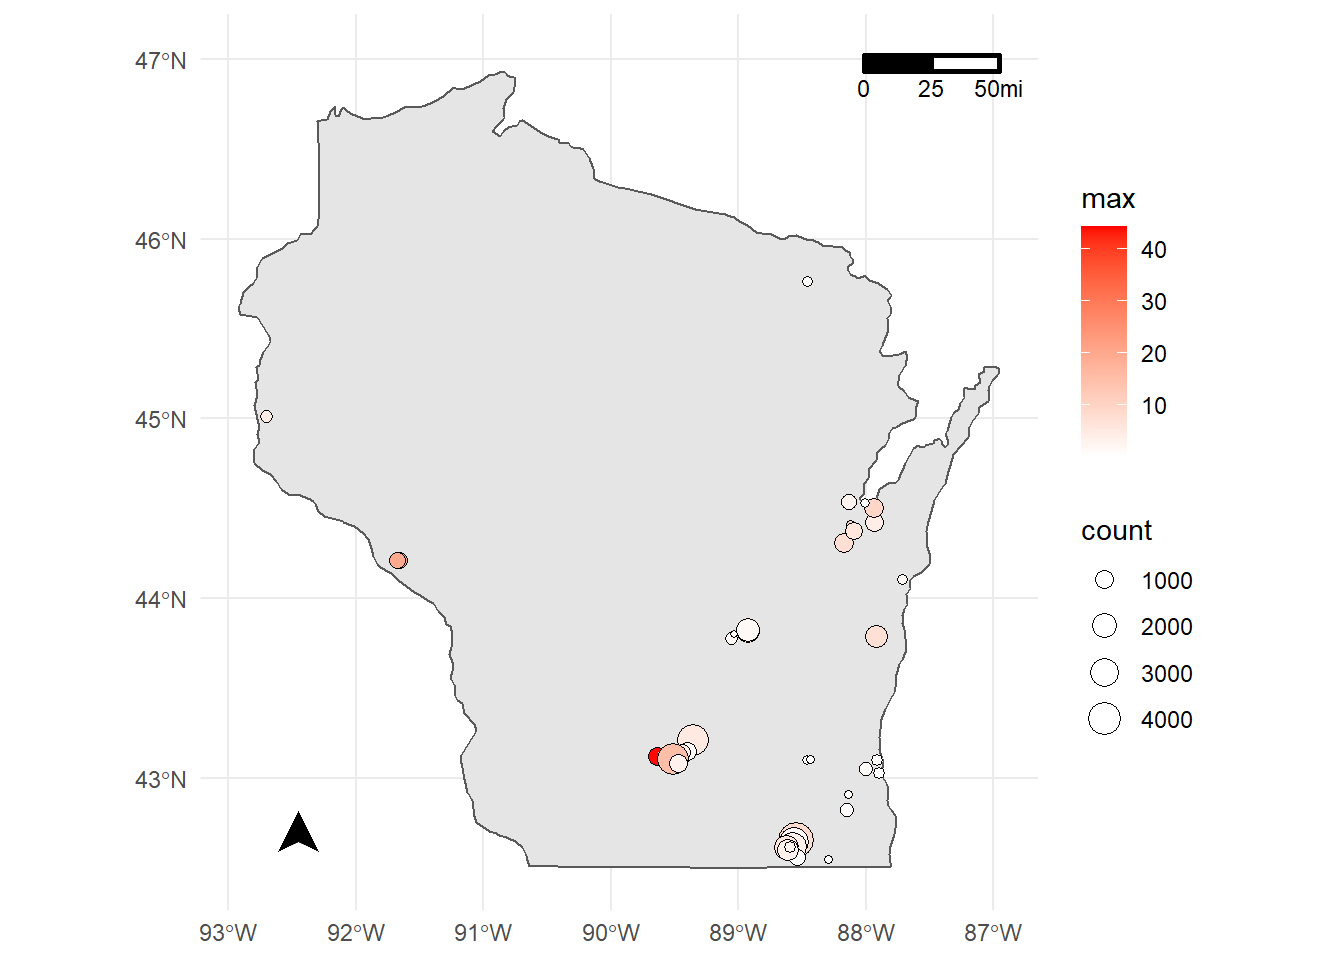
A pipeline-based approach for making large data pulls from Water Quality Portal
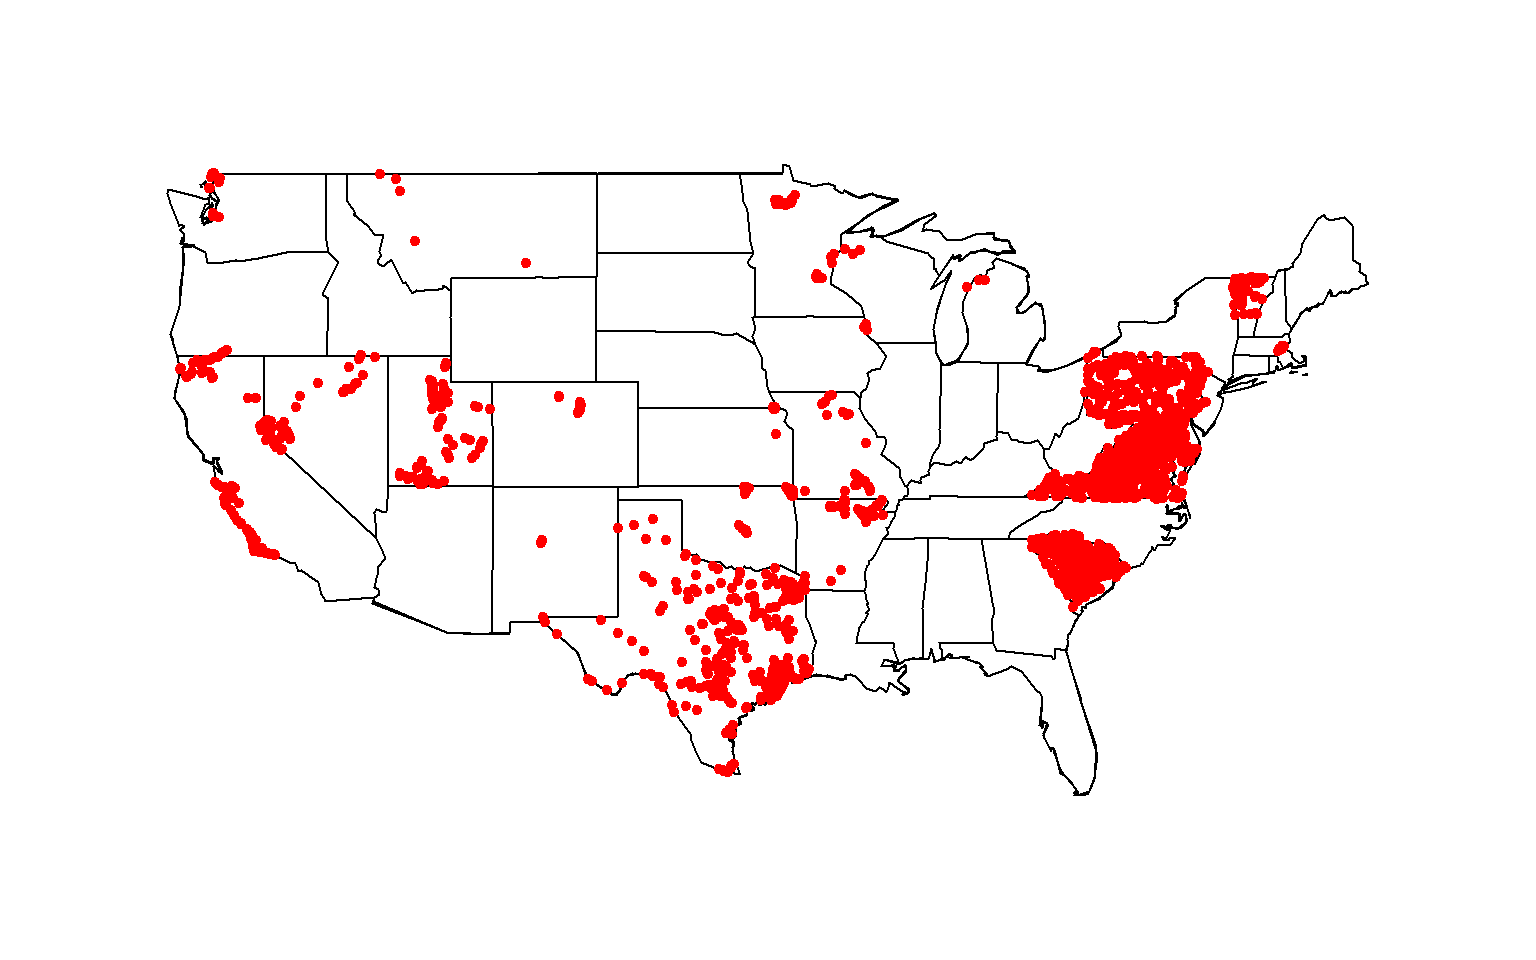
Large pull for all total nitrogen data for streams in the contiguous United States with sites that have at least 40 measurements between 1995 and 2020.
Basic dataRetrieval tutorial for USGS water data in R.
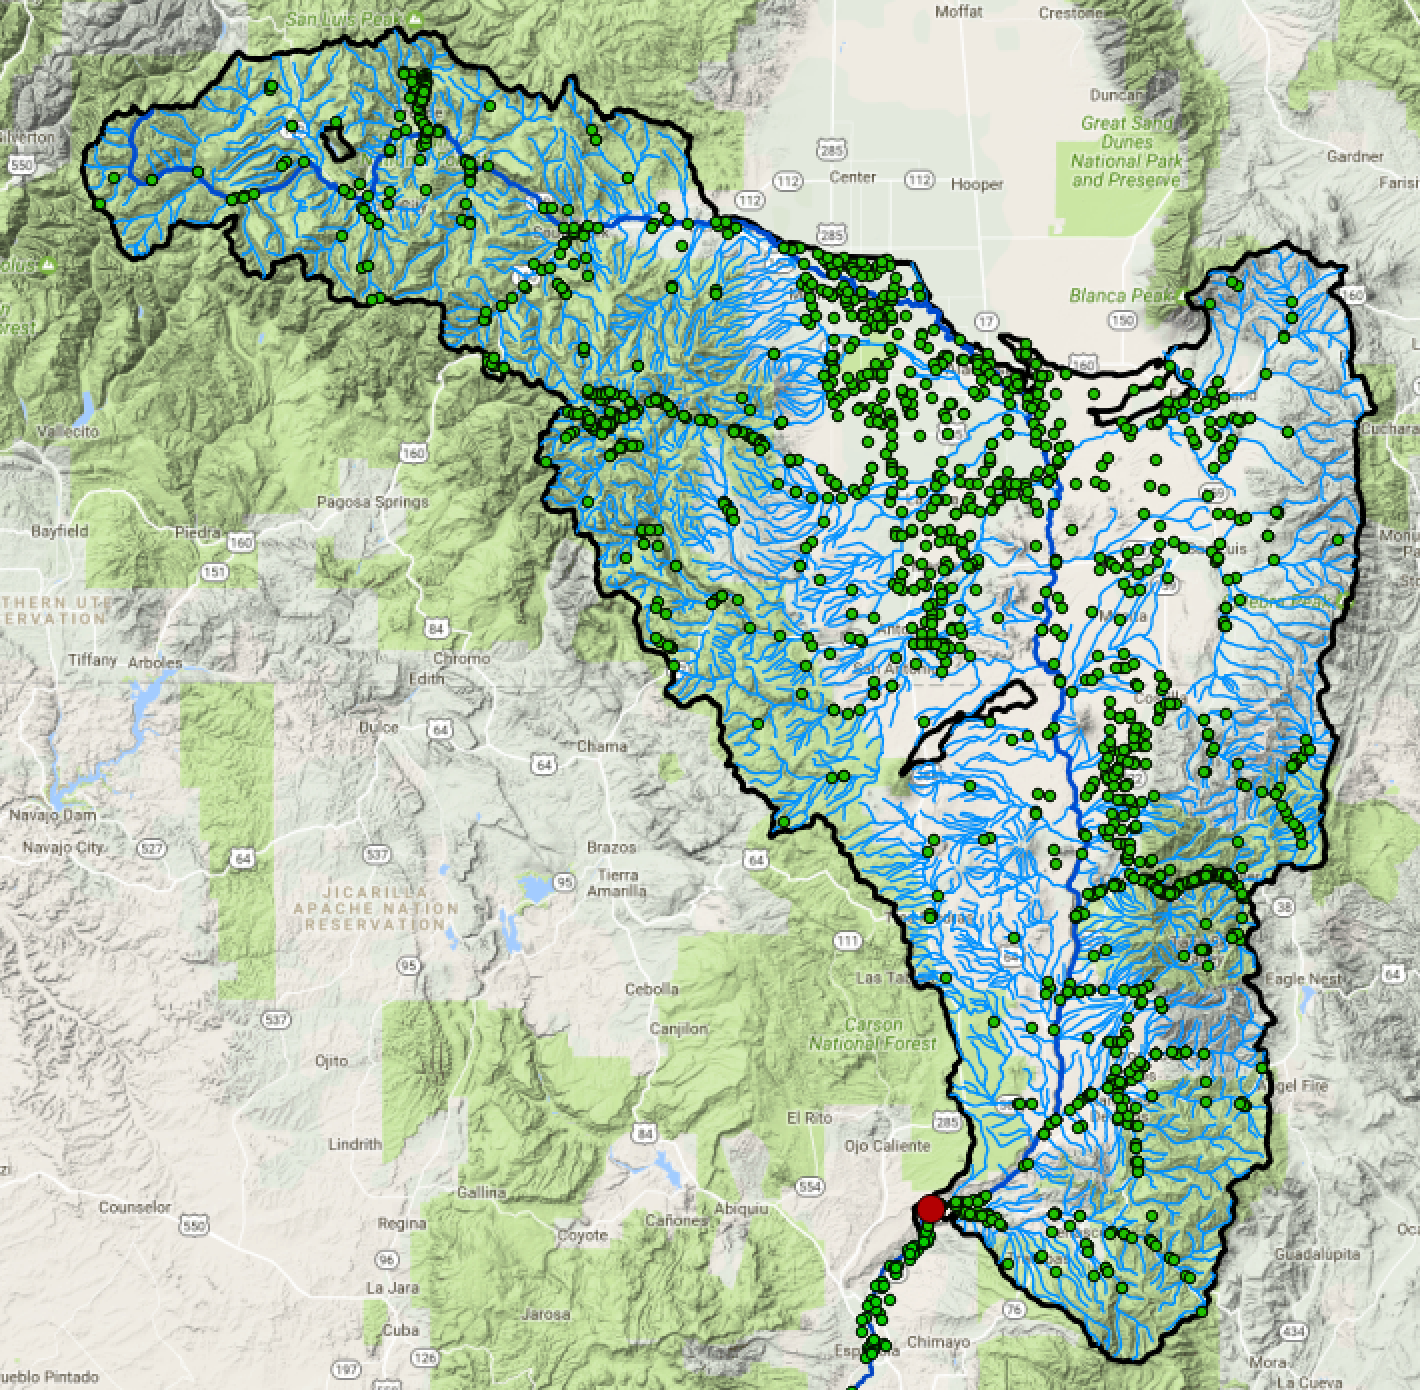
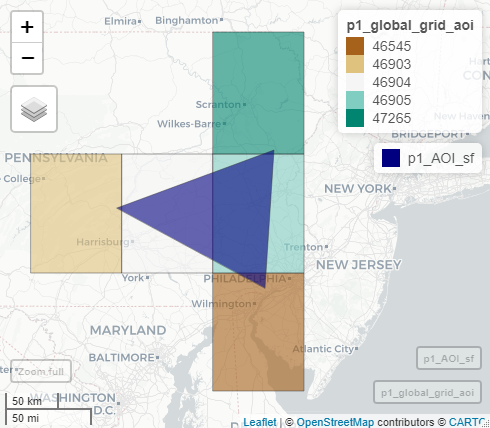
Access subsets of NHDPlus data and discover sites on the river network with the hydro Network Linked Data Index. Navigation types include upstream mainstem, upstream with tributaries, downstream mainstem and downstream with diversions. Services to provide a basin boundary, linked NWIS stream gage sites, water quality data sites, and twelve digit hydrologic unit code (HUC) watershed outlets.
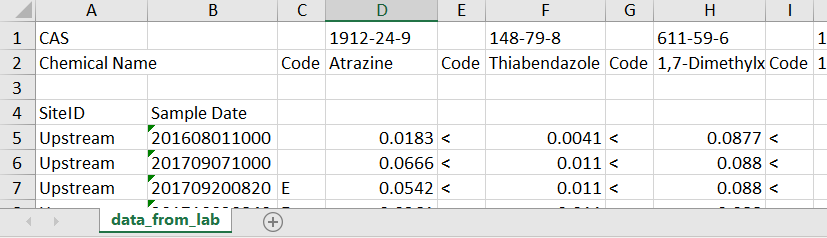
Convert wide water quality data wide to long with new tidyverse convention.