
National Water Availability Assessment Data Companion
The National Water Availability Assessment Data Companion provides a centralized source for national water availability data, including quantity, quality, and use across approximately 80,000 sub-watersheds nationwide.
What's on this page
The National Water Availability Assessment explores water availability by modeling water supply and demand across the U.S. Highlighting changes in water supply and demand will help identify when and where the nation may have challenges meeting water demands due to insufficient water quantity or quality. The National Water Availability Assessment Data Companion delivers critical data supporting the Assessment through easy-to-use data access tools.
This blog provides a one-stop overview of the Data Companion data, tools, and tutorials.
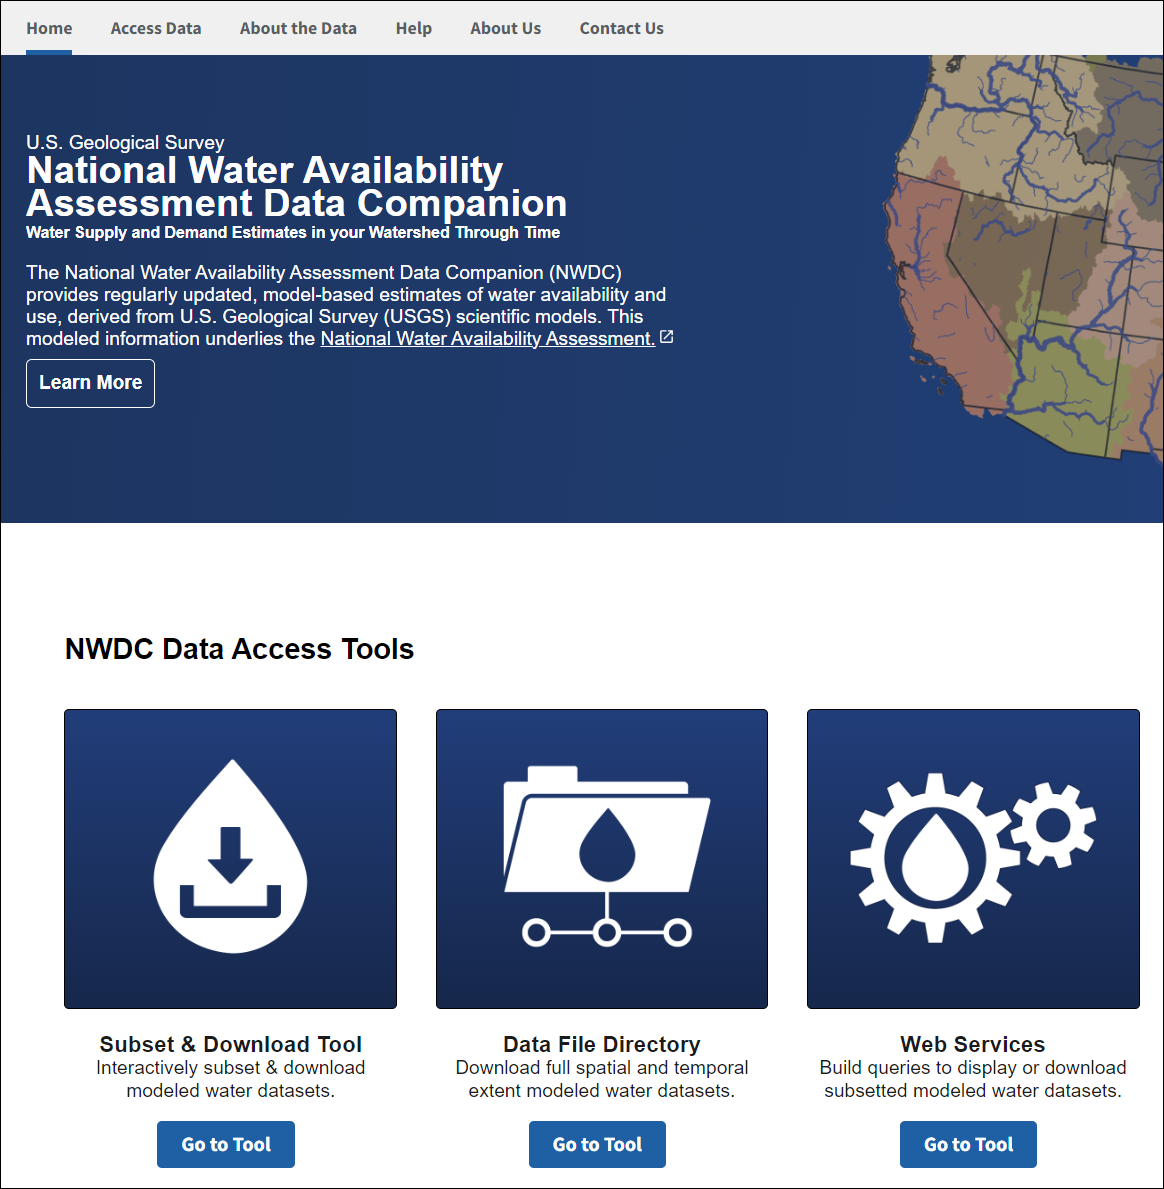
The National Water Availability Assessment Data Companion provides water availability data through the Subset & Download Tool, Data File Directory, and Web Services.
Data Companion in context
The Data Companion is a centralized website providing USGS model-derived water availability, supply, and use information that underlies the National Water Availability Assessment Report .
Don't have time to read the full report?
Walk through the key findings of the report with data-driven storytelling and interactive visualizations on the Water Availability in the U.S. website.
The Data Companion complements Water Data for the Nation (WDFN), which serves real-time and historical observed water data at surface and groundwater monitoring locations across the U.S. The Data Companion extends WDFN’s publicly available water data by providing modeled data that are spatially and temporally continuous, filling in spatial gaps between monitoring stations and temporal gaps between periodic samples at these stations.
About the data
The data delivered on the Data Companion are comprised of hierarchical categories, beginning with sector then broken down into models and variables. The three sectors with data available now are Water Quantity, Water Use, and Integrated Water Availability. Water Quality and Aquatic Ecosystem sectors are forthcoming.
Regardless of sector, all Data Companion data are available in consistent formats at a monthly timescale and delivered by sub-watershed in the lower 48 states. Sub-watersheds are the 12-digit Hydrologic Unit Codes, or HUC12s, which are tracts ranging approximately 10,000 to 40,000 acres. Puerto Rico, Alaska, and Hawaii are forthcoming.
Water Quantity Sector data
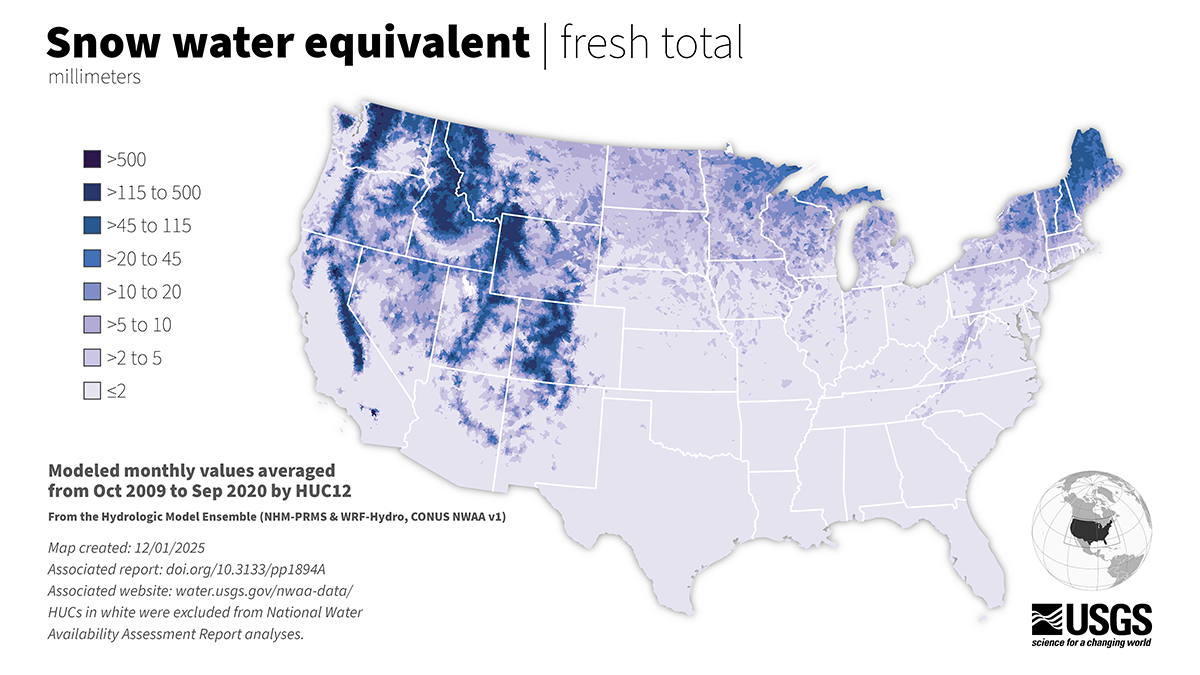
Snow water equivalent, which is a key water quantity variable, across the lower 48 United States.
Water quantity, which is the amount of water naturally supplied through atmospheric inputs, is critical within the water cycle and to understanding water availability. View all of the available data and more information on the underlying models on the Water Quantity Sector page. Interrelated components of natural water supply include:
- Precipitation, which is the total amount of water released from clouds in the form of rain, freezing rain, sleet, snow, or hail. It represents the flux of water from the atmosphere to the land surface.
- Actual evapotranspiration, which represents the total flux of water back to the atmosphere via evaporation and plant transpiration.
- Snow water equivalent (SWE), which is the depth of water stored in the snowpack in both liquid and solid forms.
- Soil moisture fraction, which represents relative soil-moisture volumes ranging from 0 (representing the permanent wilting point) to 1 (representing the field capacity or porosity) to estimate the accessible part of soil water in the upper part of the soil column.
- Incremental baseflow, which does not include baseflow contributions from upstream. (Baseflow is the amount of groundwater flowing to streams.) Incremental baseflow combined with incremental quickflow constitute local contributions to the channel. When combined with upstream channel inflows, these fluxes determine streamflow in a reach.
- Incremental quickflow, which does not include quickflow contributions from upstream, so its contribution is localized to the subwatershed. (Quickflow is the amount of water coming from overland and shallow subsurface flow.)
- Incremental runoff, which does not include runoff contributions from upstream, so its contribution is localized to the catchment. (Runoff is the total amount of water coming from both baseflow and quickflow.)
Modeled precipitation data are provided via the Atmospheric Forcing Model and the remaining water quantity variables are modeled with the Hydrologic Model Ensemble .
Water Use Sector data
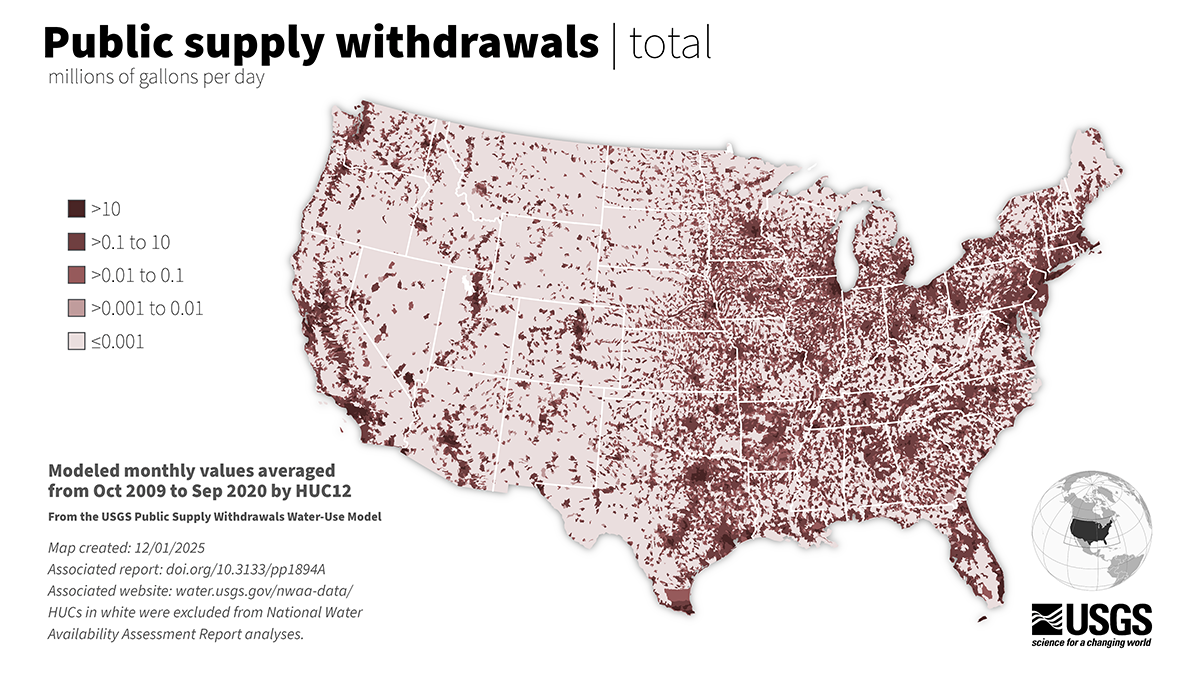
Total withdrawals for public supply use, which is a key water use variable, across the lower 48 United States.
Water use refers to the amount of water withdrawn, delivered, and consumed for human purposes including public supply, irrigation, and thermoelectric power generation. Water use data are split into several related categories:
- Category of use: The Data Companion will provide regularly updated, model-based estimates of eight categories of water use (thermoelectric, public supply, crop irrigation, domestic self-supply, mining, aquaculture, industrial, and livestock). As of now, thermoelectric, irrigation, and public supply are available through the Data Companion. Visit the Water Use in the United States page to learn more.
- Fate of water: Water use data are split into consumptive use versus withdrawals, with withdrawals representing the total water diverted for that use and consumptive use representing the portion of the withdrawal that is not returned to the environment and instead is evaporated to the atmosphere, consumed by humans or livestock, or incorporated into products or crops.
- Source of water: Water use data provided as a total amount or by source, including surface water or groundwater.
Interrelated components of water use include:
- Thermoelectric Power Water Use, which is primarily used for cooling purposes and is withdrawn from a source, routed through a plant’s condenser to cool the steam used to generate electricity, and consumed in a cooling system via evaporation. Thermoelectric are further separated into freshwater versus saline water, where available.
- Crop Irrigation Water Use, which are separated by model:
- Crop Irrigation Withdrawals Water Use, which is defined as water removed from a groundwater or surface-water source to produce agricultural crops.
- Crop Irrigation Consumptive Water Use, which is defined as the amount of water removed from a surface-water body or aquifer that was used to grow crops and was lost to evapotranspiration; it excludes rain and snow directly on agricultural fields that contributed to evapotranspiration.
- Public Supply Water Use, which is defined as water volumes withdrawn by public and private water suppliers that provide water to at least 25 people or have a minimum of 15 connections for at least 60 days. Public Supply water use data are separated by model:
- Public Supply Withdrawals Water Use, which is modeled by combining reported historical information with an array of different hydroclimatic, demographic, socioeconomic, geographic, and land use factors to compute public supply withdrawals across CONUS.
- Public Supply Consumptive Water Use, which is calculated by combining modeled public supply deliveries and estimates of evaporative demand, assuming that on average 50% of total domestic and commercial, industrial, and institutional deliveries for the CONUS are used for outdoor purposes.
When fully implemented, the information in the Data Companion will cover past conditions over multiple decades and include updated information on current or near-current conditions and forecasts of future conditions. This modeled water-use information provides the most current USGS estimates of water use in the United States.
Integrated Water Availability
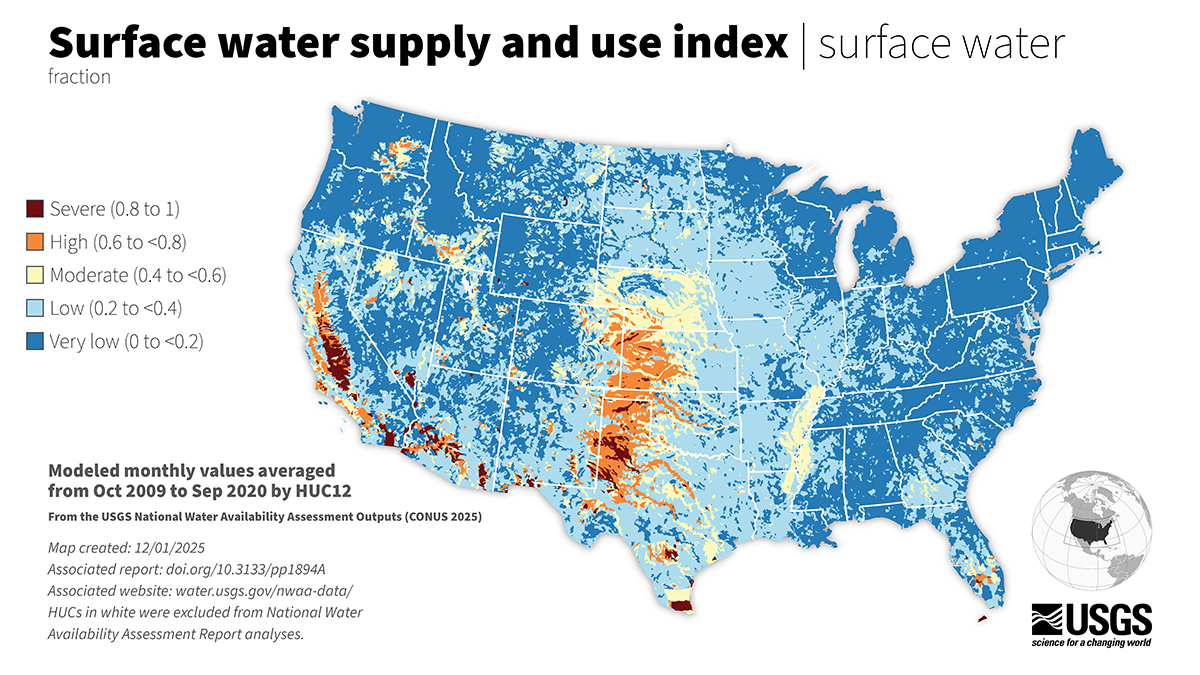
Categories of the surface water supply and use index, which is a key water availability variable, across the lower 48 United States.
Integrated water availability is the amount of water available for human and ecological needs after accounting for quantity and quality in both surface water and groundwater. One of the primary ways water availability is quantified is by calculating the amount of water remaining after accounting for natural water supply and total human water use (defined by consumptive use).
The Integrated Water Availability data include information on water availability produced as part of the 2025 Integrated Water Availability Assessment report . The outputs include estimates of:
- Total Water Availability, which refers to the total amount of water exiting a particular HUC12. The amount is calculated as the net of streamflow inputs minus total consumptive water use locally and upstream.
- Streamflow, which is computed as the gross cumulative water supply from upstream plus total water supply generated within the local HUC12.
- Total water consumption, which refers to the total amount of water consumed for public supply, thermoelectric power, and crop irrigation.
- Surface Water Supply and Use Index, which expresses the fraction of the median long-term water supply at a HUC12 that is unavailable either because of climatic variability (e.g. an unusually dry year) or because the water is used consumptively for crop irrigation, thermoelectric power, or public supply. Higher values indicate a higher potential water limitation because a higher proportion of the typical water supply is unavailable. The SUI varies between 0 (no apparent limitation) and 1 (total depletion of the local water supply).
Access and use the data
The goal of the Data Companion is to make it easy for users to access and use nationally consistent modeled water data. These tools are the three main ways to access data, allowing customized queries for many use cases.
Subset & Download Tool
Use the Subset & Download Tool to download Data Companion data by model and to generate syntactically correct URLs to use with Web Services. Datasets can be subset by specific region and/or time period.
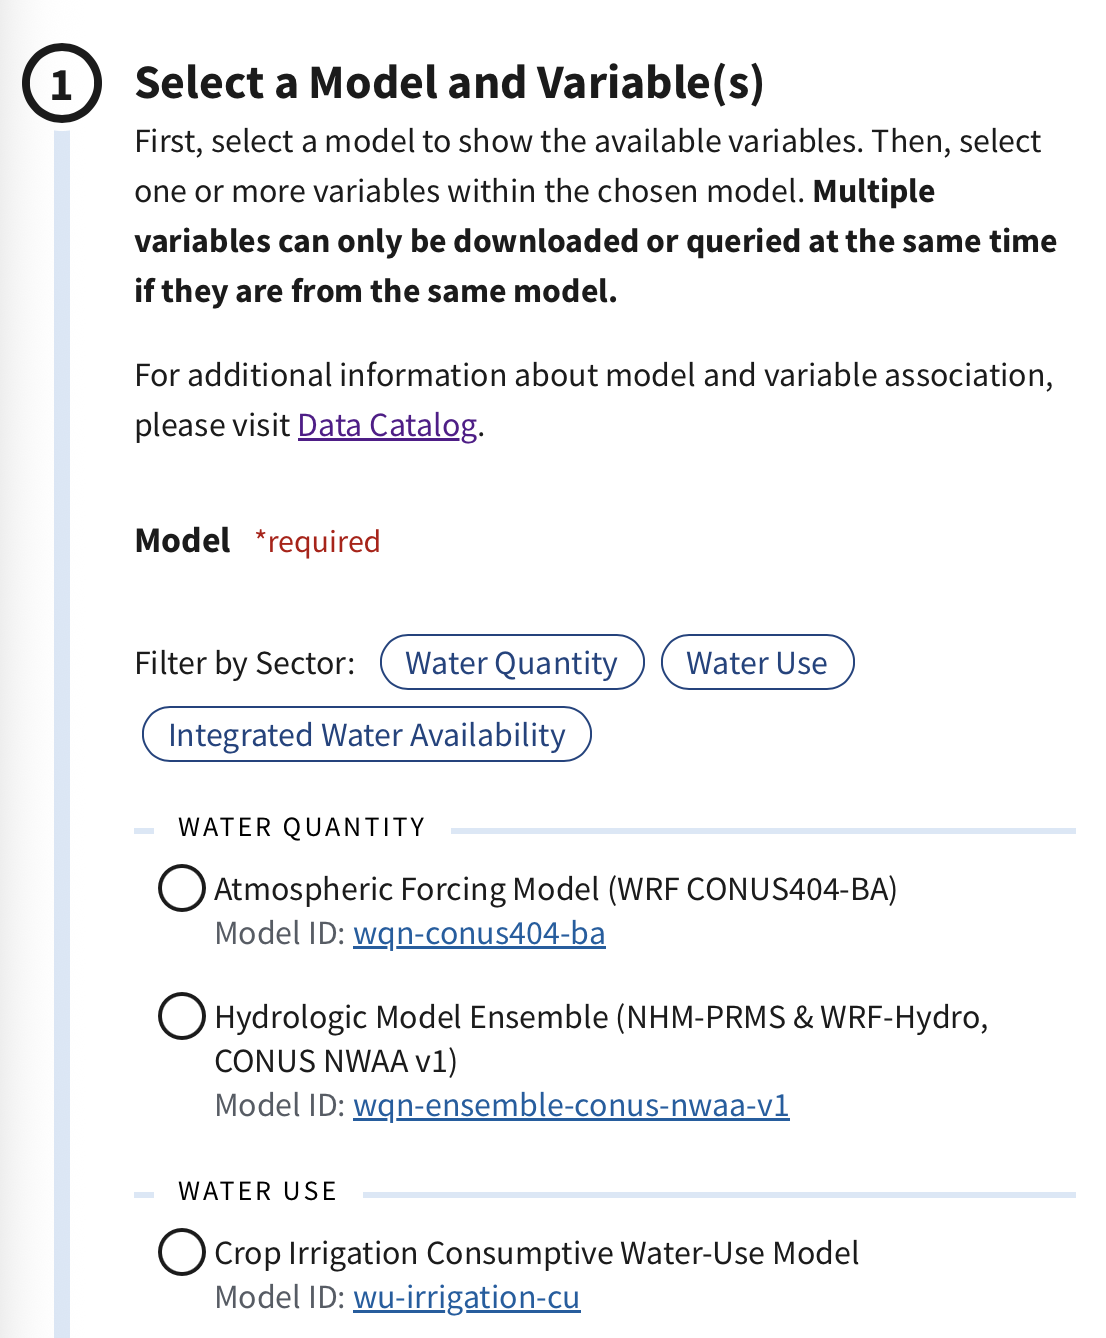
- Select a model and variable(s), which are described above in the previous section
- Select a spatial extent, such as HUC level (e.g., HUC12 or HUC8) or by state or county
- Select a temporal resolution, such as monthly or annually by water year or calendar year
- Select a date range, such as the most recent timepoint or a custom date range
- Select an output format, such as
.json,.csv, or.geojson - Access results. When all required filters have been selected, the generated URL and data file below will give the data based upon the selections above. Be sure to use the best filters possible to reduce the records to only those that you need.
The Subset & Download Tool Tutorial
is found in the Resources menu under Tutorials, and shows users how to use the Subset and Download Tool to download a .csv file of monthly groundwater withdrawals for crop irrigation in Dane County, Wisconsin in calendar year 2019.
Data File Directory
Use the Data File Directory to browse and access files containing the full spatial and temporal extent of NWDC datasets. Folders are organized by sector, then model, and finally variable, which are described in the previous section about the data.
Once you’ve selected the sector and model of your choice, you will see a series of files. These files use abbreviations that are listed in the Data Companion’s Glossary page found in the Resources menu.
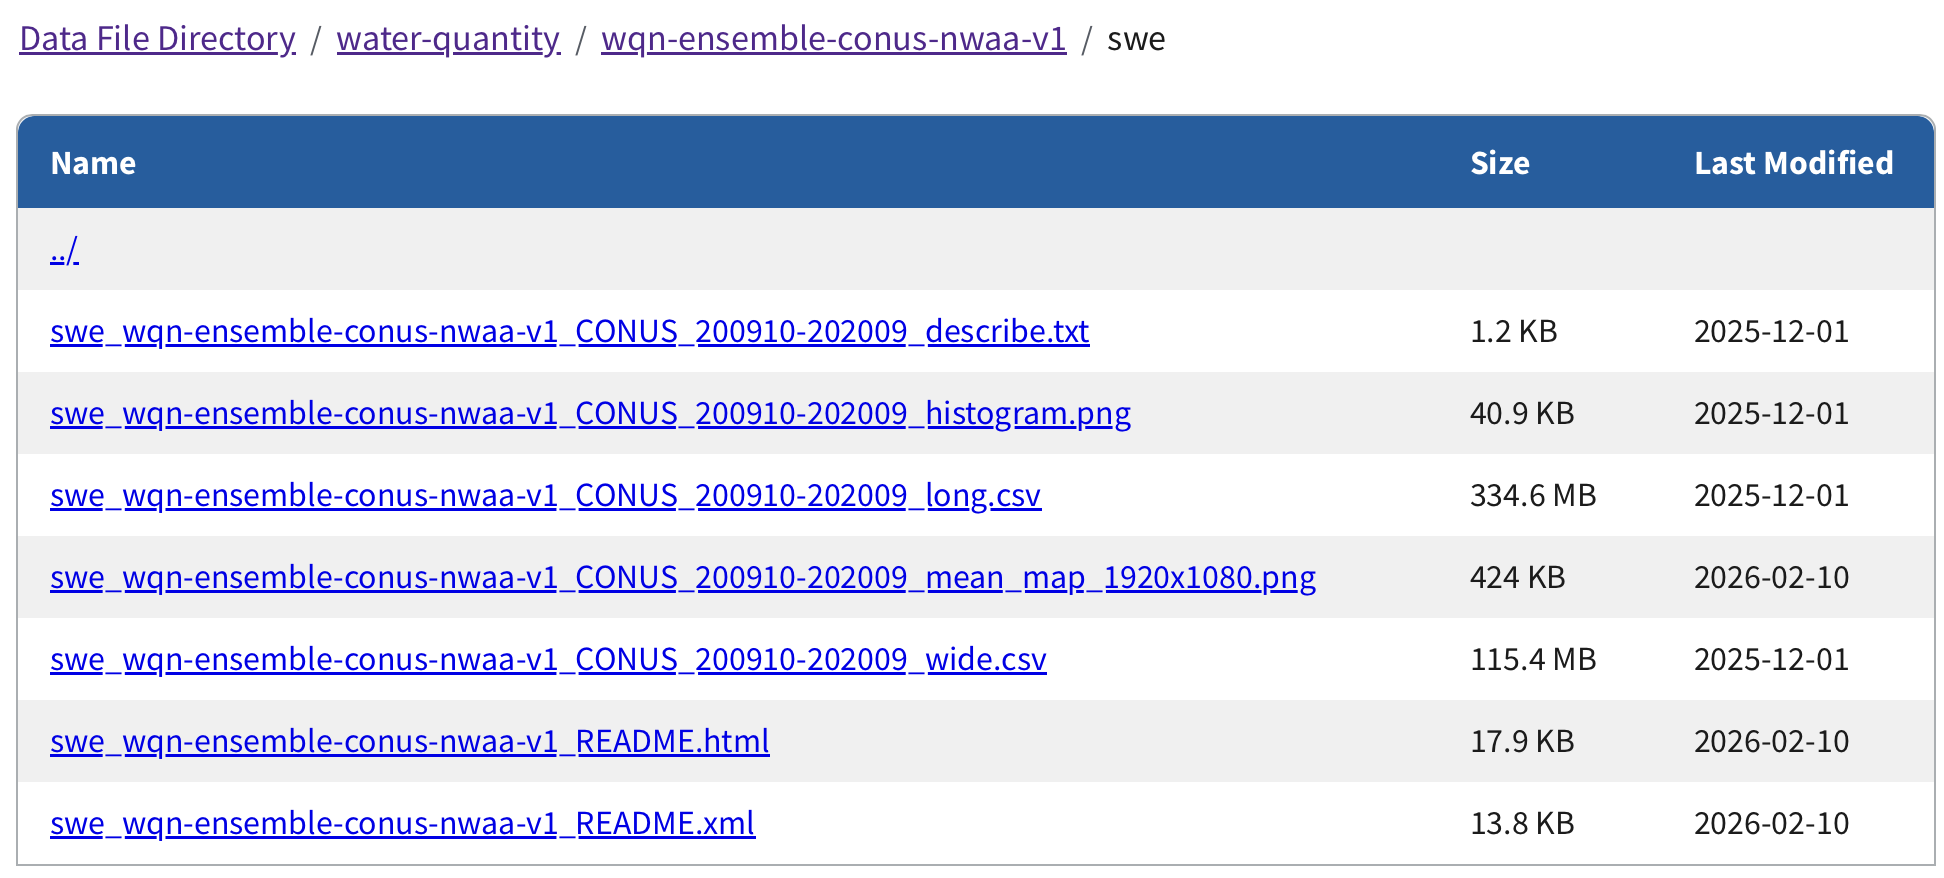
Screenshot of the Data File Directory for the Snow Water Equivalent (swe) variable.
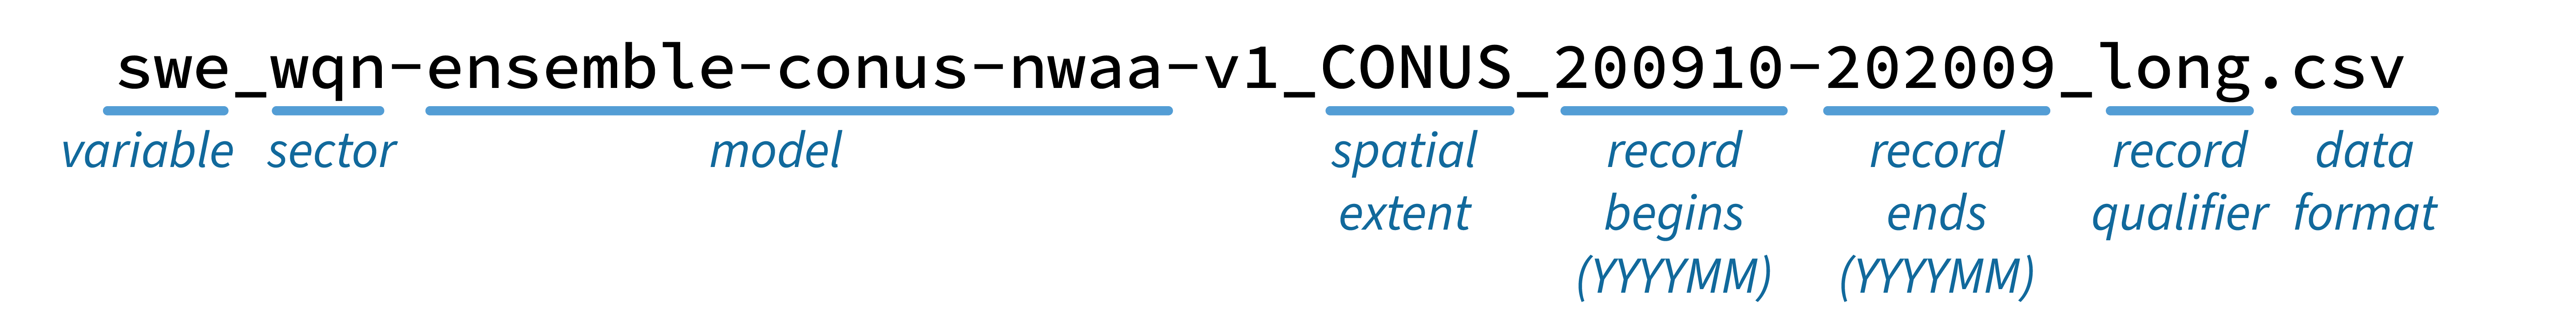
Each file in the Data File Directory is named with a parallel format, showing the variable, model, spatial extent, date range, and then record qualifiers and format.
The following example, which is for the Snow Water Equivalent (swe) variable in the Water Quantity Sector (wqn), includes:
swe_wqn-ensemble-conus-nwaa-v1_CONUS_200910-202009_describe.txt- statistics describing snow water equivalent, including total observations, missing values, mean, median, etc.swe_wqn-ensemble-conus-nwaa-v1_CONUS_200910-202009_histogram.png- image showing distribution of snow water equivalent in millimetersswe_wqn-ensemble-conus-nwaa-v1_CONUS_200910-202009_long.csv- data provided in long format, which has one row for each HUC12 and date combinationswe_wqn-ensemble-conus-nwaa-v1_CONUS_200910-202009_mean_map_1920x1080.png- map showing mean Snow Water Equivalent across the lower 48 United States in millimetersswe_wqn-ensemble-conus-nwaa-v1_CONUS_200910-202009_wide.csv- data provided in wide format, which has one row for each HUC12 and rows for each monthswe_wqn-ensemble-conus-nwaa-v1_README.html- README metadata in.htmlformatswe_wqn-ensemble-conus-nwaa-v1_README.xml- README metadata in.xlmformat
The Data File Directory Tutorial
is found under the Resources menu. The tutorial the Data File Directory is used to download a .csv file of monthly groundwater withdrawals for crop irrigation across all lower 48 states (CONUS) between January 2000 and December 2020 (the full period of record).
Web Services
The Data Companion’s Web Services provide access to national-scale USGS modeled water availability data underlying the National Water Availability Assessment. These queries allow for full customization, including model and variable, spatial extent, and timeframe. The queries use the same abbreviations used in the Data File Directory , which are listed in the Data Companion’s Glossary page found in the Resources menu. Users can also build a Web Services URL interactively with the Subset & Download Tool .
Returned responses from the data endpoint can be either .json, .geojson, or .csv. Returned responses from all metadata endpoints are in .json format.
The Web Services Tutorial
is found in the Resources menu under Tutorials. The tutorial demonstrates how to build a URL for Web Services to download a .csv file of monthly groundwater withdrawals for crop irrigation in Kern County, California between January 2018 and December 2020 (a partial period of record).
Additional tutorials available in Python and R
Create CONUS map of historical water use
In this tutorial, users are shown how to download a `.csv` file of monthly mean daily total public supply consumptive use across all lower 48 United States (referred to as the continental United States, CONUS) on HUC12s (subwatersheds) from January 2000 to December 2020 (the full period of record) via the Data File Directory. Users can then create a map showing the largest monthly mean daily consumptive use value for each HUC12 over the period of record where values are larger than 0.1 million gallons per day (MGD).
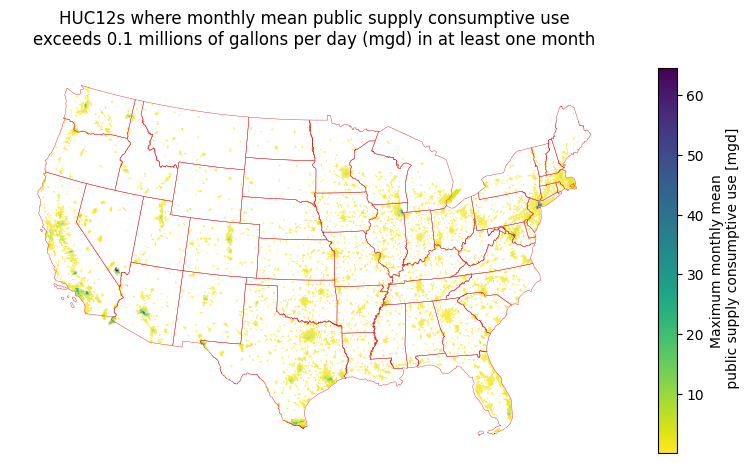
The resultant map from this tutorial, using Python
Create bar graphs of statewide water use
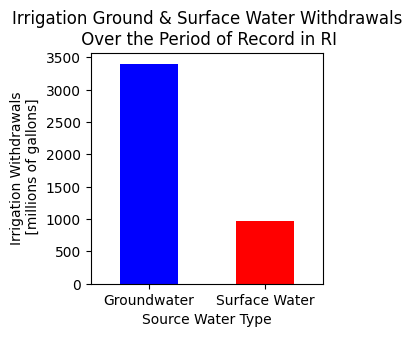
In this tutorial, users are shown how to use the Data File Directory to download and pare down data on crop irrigation total withdrawals, crop irrigation groundwater withdrawals, and crop irrigation surface-water withdrawals for all HUC12s (subwatersheds) within Rhode Island from January 2000 to December 2020 (the full period of record). Users can then examine irrigation withdrawals by source water type over the period of record by generating a time series plot of monthly mean daily withdrawals and a bar graph and map of total withdrawals.
Plot time series of irrigation withdrawals in a local HUC12
In this tutorial, users are shown how to query web services to download data for crop irrigation total withdrawals, crop irrigation groundwater withdrawals, and crop irrigation surface-water withdrawals for a single HUC12 (subwatershed) within Rhode Island from January 2000 to December 2020 (the full period of record). Then, users can examine irrigation withdrawals by source water type over the period of record by generating a time series plot of monthly mean daily withdrawals and a map of total withdrawals.
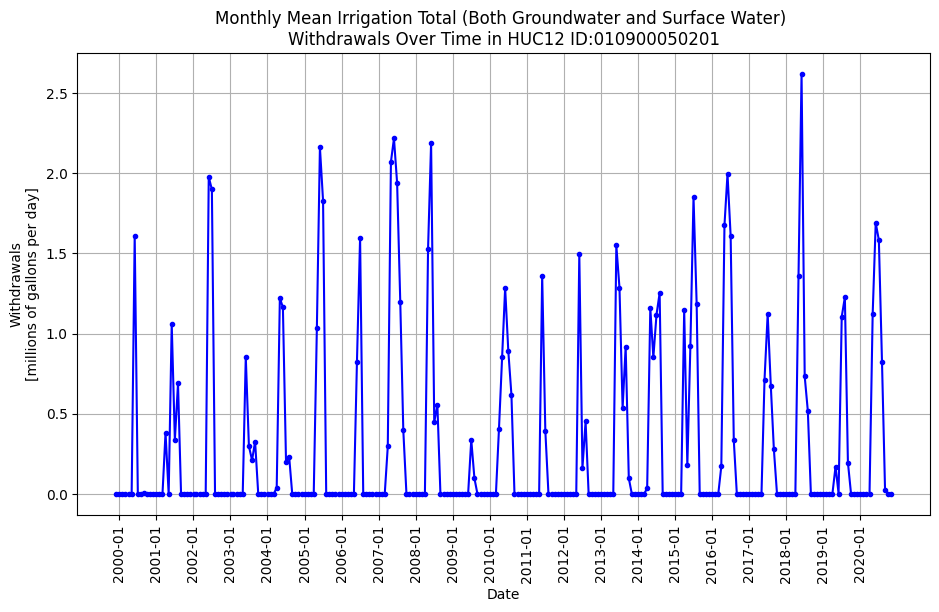
The resultant timeseries from this tutorial, using Python
Future Improvements
The Data Companion is under active development. New website features and model outputs will be added regularly. Continuous usability testing will guide the development of Data Companion features and content, ensuring the site delivers actionable information in the most user-friendly way.
If you are interested in helping us improve the Data Companion by participating in usability testing, please sign up here .
Categories:
Related Posts
WaterServices APIs will be decommissioned early 2027
January 7, 2026
We have released modernized Water Data APIs which will supersede the WaterServices family of APIs. WaterServices will be decommissioned in the first quarter of 2027. We will have more information about the decommission process, which may include intentional service degradation and blackouts, in the second half of 2026. We will not begin any intentional degradation of these services before August 2026.
Metadata in Water Data for the Nation
December 29, 2025
Introduction
Metadata are crucial to interpreting and understanding USGS water data. Metadata are data that provides information about other data. They provide important context to the water data you are viewing on WDFN pages or downloading from USGS Water Data APIs . USGS water data metadata includes codes and abbreviations, such as parameter codes, method codes, and observed properties.
Daily data in Water Data for the Nation
November 21, 2025
There have been a lot of changes to how you access USGS water data as we work to modernize data delivery in WDFN and decommission NWISWeb. As we centralize and re-organize data delivery in WDFN, we have recently set out to describe different types of water data according to data collection categories . We started with re-organizing and expanding the data collection categories that are delivered on the Monitoring Location Page and are now working to deliver additional data collection categories on other WDFN pages as well. This blog is part of a series to help orient you to where you can find different types of data in WDFN pages and services. In this post, we want to focus on how you can access daily data in WDFN.
Decommissioning Legacy gwlevels and SensorThings APIs – Fall 2025
September 23, 2025
Background
For over 15 years, the USGS has provided machine-readable and automated access to water data via the WaterServices family of application programming interfaces (APIs), which are hosted at https://waterservices.usgs.gov/ . These APIs underpin all other USGS web delivery products – including products such as the National Water Dashboard and Water Data for the Nation (WDFN) – and have been incredibly effective at delivering water data to the public. Between October 2024 and March 2025 alone, these legacy APIs have handled more than 1.6 billion requests from almost 3.5 million distinct IP addresses.
New Feature - Field Measurements
September 23, 2025
We are excited to announce a new feature on Monitoring Location pages that provide field measurements, which are physically measured values collected during a field visit to a monitoring location.