
Release Notes for September 25, 2019
A summary of new features and tools released on September 25, 2019
What have we been up to?
This is the first of a series of posts in which newly released features in the Water Data for the Nation family of applications are described. The team that generates Water Data for the Nation applications is aiming to get into a pattern of regular releases – every two weeks or less–of small improvements and new features. In addition to core USGS water data tools on waterdata.usgs.gov and waterservices.usgs.gov, the applications that we have or will be working on include the Water Quality Portal, the National Groundwater Monitoring Network and the USGS Publications Warehouse.
New features and tools
Monitoring Location pages
Custom Time Ranges
Out of the hundreds of comments submitted by users on the new real-time data pages, one of the most requested features of the new pages was the ability to display a custom time range, in addition to the three current choices of seven days, 30 days, and one year. This is now possible- users can choose any time range desired.
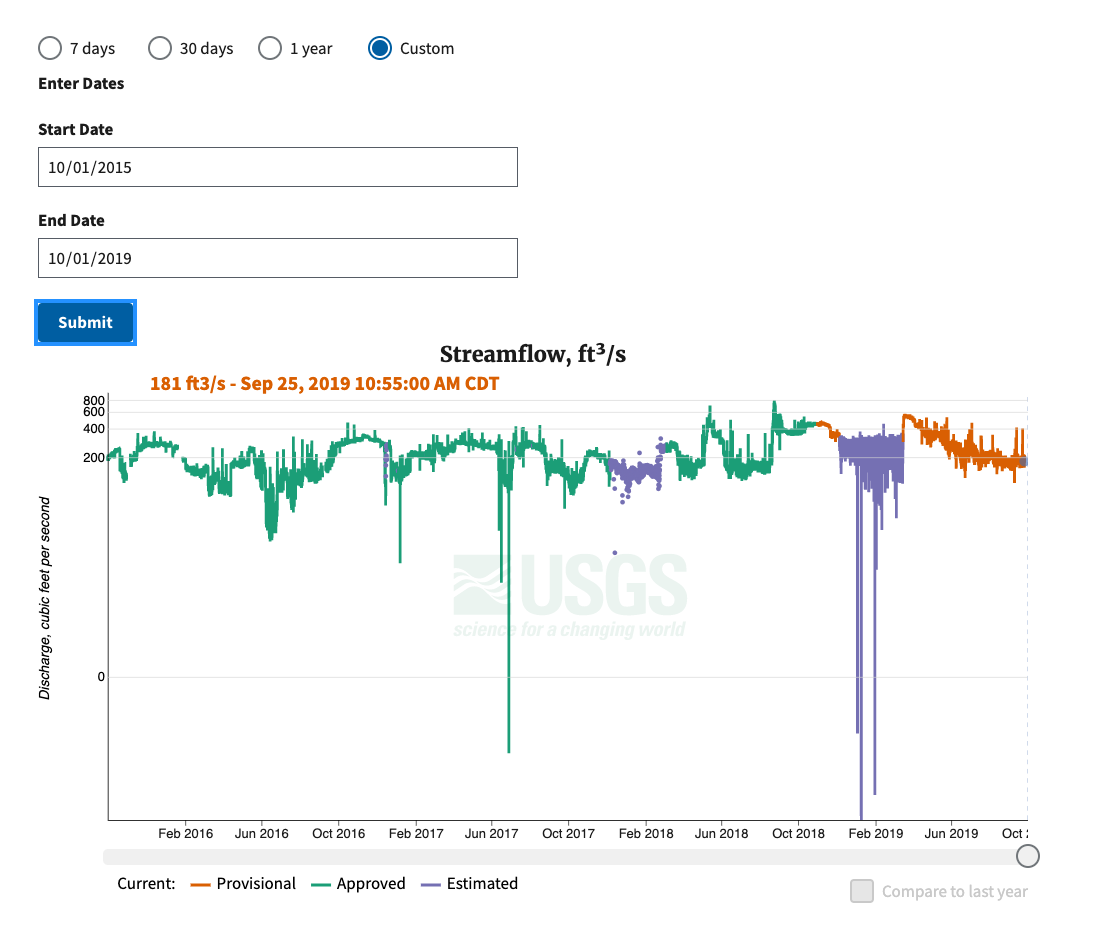
Graph showing three years of discharge data at USGS monitoring location 05428500, Yahara River at East Main Street at Madison, WI
There is still a lot to do on these hydrographs, and we plan to add additional features such as validation of period of record and letting users know the maximum time range available, as well as more effective tools to allow for interacting with the plots and drilling down into the details of the data.
Upstream and downstream monitoring locations
Another commonly requested feature is the ability to navigate along a stream to upstream and downstream monitoring locations. We now have this feature for every active surface water site! If you navigate to the map towards the bottom of a monitoring location page, we display all active monitoring locations with time series data 200 miles upstream and downstream on the main stem of the stream of the current monitoring location.
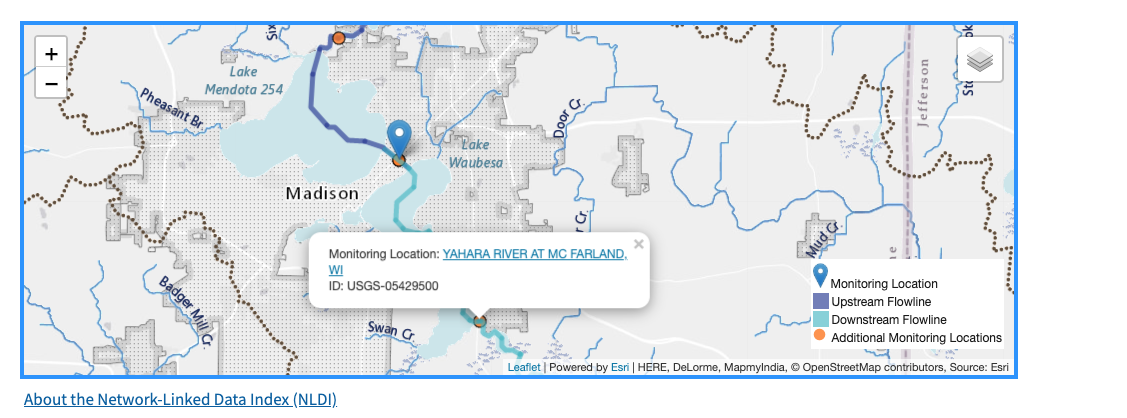
Map showing monitoring locations upstream and downstream of USGS monitoring location 05428500, Yahara River at East Main Street at Madison, WI
This feature is made possible by a tool called the Hydro-Network Linked Data Index (NLDI). In the near future, we are expecting to extend this feature to include all upstream monitoring locations and basins (as well as basin characteristics).
Flipped axis for groundwater levels
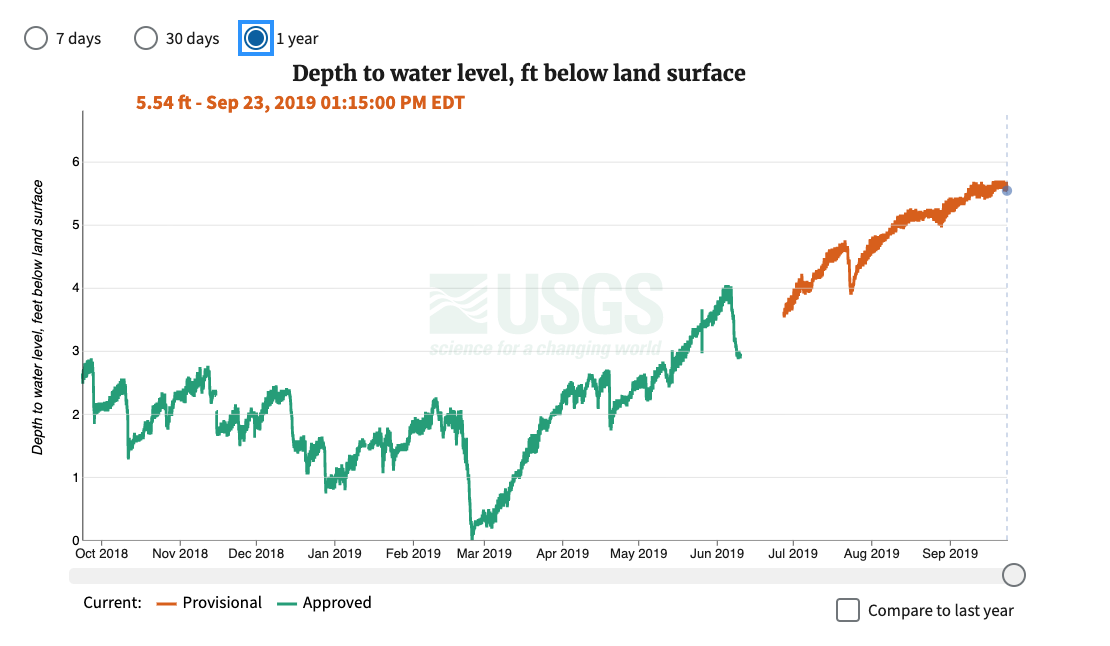
Groundwater levels at the USGS are typically measured as the water level in feet below the land surface, rather than as a negative elevation. As a result, the graphs that we have been generating for ground water sites have been effectively “upside down”: when the level of the water was down with respect to the surface of the earth, the graph would go up- and vice-versa. We have now taken care of this by simply following the convention of flipping the axis.
Previously, one year of data at a site with the data “upside down.” The level of water in the well is actually going down from March through September, not up.
One year of water levels measured as Depth to water level, feet below land surface, at USGS Monitoring Location 370812080261901, 27F 2 SOW 019, without the Y axis flipped.

One year of water levels measured as Depth to water level, feet below land surface, at USGS Monitoring Location 370812080261901, 27F 2 SOW 019, with the Y axis flipped.
Groundwater data display is an area that we will significantly extend in the coming months. For a view into the future of groundwater data display at the USGS, please take a look at the same site as above in the National Groundwater Monitoring Network Data Portal, another site that the USGS Water Data for the Nation development team works on. Technologies and data displays piloted in the National Groundwater Monitoring Network will be leveraged here.
Initial roll-out of Water Data Labs
While labs will warrant another follow-up post, I will give a quick overview here.
Water Data Labs is an experimental space where the USGS Water Data for the Nation development team is able to learn how to run new kinds of cloud-native, high performance tools that will form the basis of the future of Water Data for the Nation products. In addition to cloud experimentation, we are planning on using labs to make available a variety of other tools:
Web services that do not have a stable API
Experimental visualizations or dashboards
Data integration prototypes
Experimental datasets and data integrations
To that end, we have released two initial products on https://labs.waterdata.usgs.gov.
Tableau Data Connector
A project that was written almost entirely by an internship project coordinated through the Water Resources Research Institutes, the Tableau Data Connector is a bridge between the waterservices.usgs.gov instantaneous values service and the Tableau data analysis tool.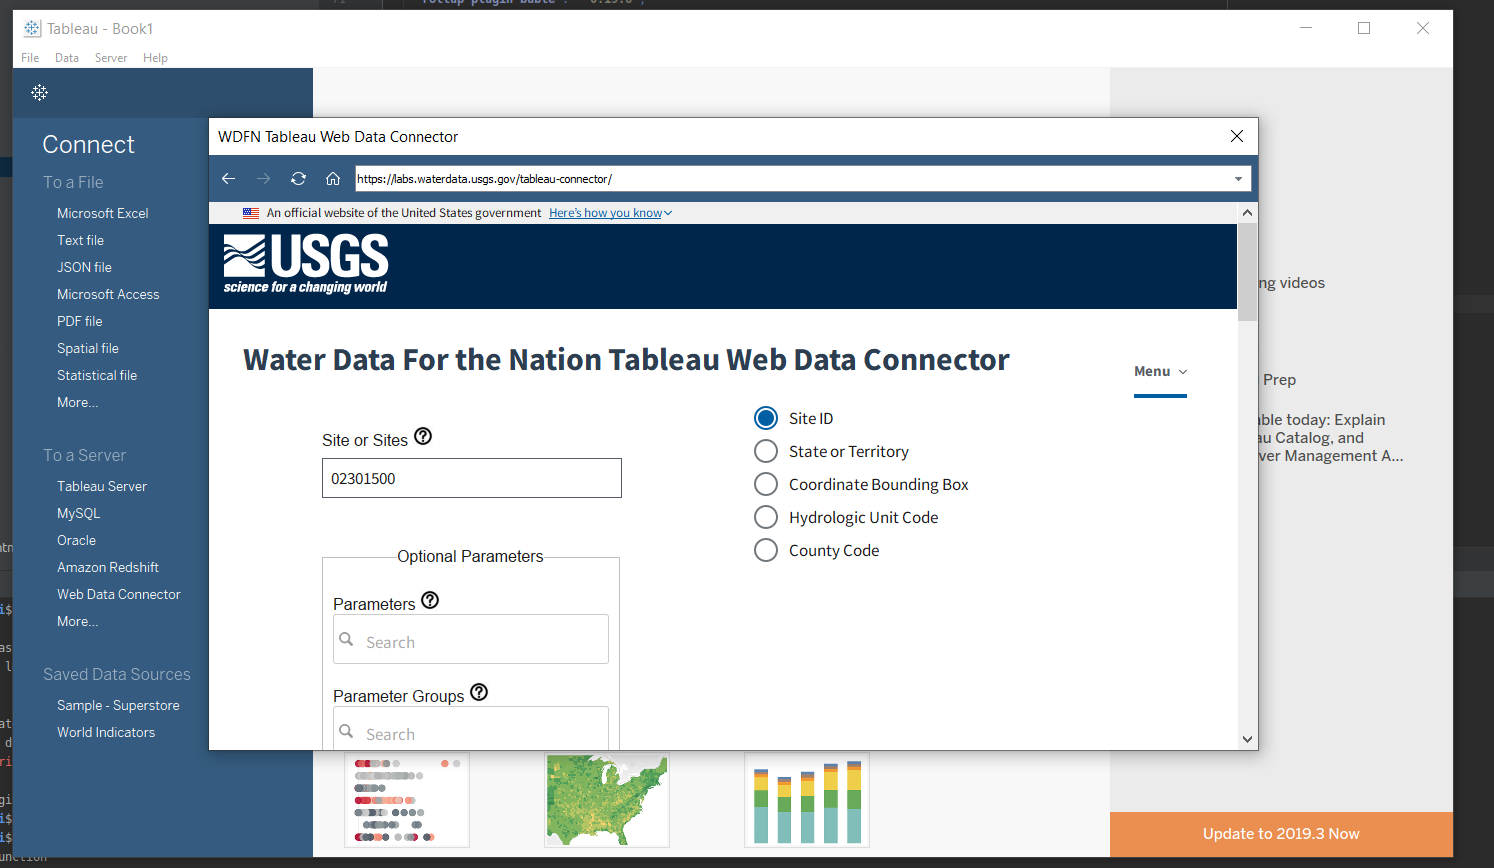
Using the Tableau Data Connector in the Tableau Desktop program.
Graph Images API
A common request from the new monitoring location pages users is that we support the ability to generate an image for embedding in third-party sites. This new API is a first step in that direction. Here is an example image, which you can see yourself with https://labs.waterdata.usgs.gov/api/graph-images/monitoring-location/09380000/?parameterCode=00060
Discharge for the past seven days at USGS Monitoring location number 09380000, Colorado River at Lees Ferry, AZ
What is coming up for next sprint
Displaying temperature data in both Celsius and Fahrenheit- a very common request!
Linking footage from USGS time lapse stream cameras into the monitoring location pages.
More sophisticated and user-friendly handling of multiple time series on the same graph.
The Hydro-Network Linked Data Index(NLDI) on labs.waterdata.usgs.gov
Disclaimer
Any use of trade, firm, or product names is for descriptive purposes only and does not imply endorsement by the U.S. Government.
Categories:
Keywords:
Related Posts
Release Notes for November 13, 2019
November 13, 2019
What have we been up to? This sprint, we have been working on a number of features that are the groundwork for future tools. Most notably, we are developing a working monitoring location services system based on the new Open Geospatial Consortium OGC API-Features standard.
Release Notes for October 16, 2019
October 16, 2019
What have we been up to? This sprint, the team has been working primarily on features that are tied to the cloud version of the USGS Publications Warehouse.
Release Notes for July 21st, 2020
July 21, 2020
What have we been up to? Pubs Warehouse moved to the Cloud Behind the scenes work New features and tools Pubs Warehouse on the Cloud The Water Data for the Nation team is the primary development team for another high profile application, the USGS Publications Warehouse.
Release Notes for late March 2020
April 10, 2020
What have we been up to? Image server work Period parameter Axis scaling Networks page New features and tools Image export from monitoring location pages One of the most requested features we receive from users is the ability to export images from the monitoring location pages.
Release Notes for late February and early March 2020
March 20, 2020
What have we been up to? Added handles to brush on the monitoring location page hydrograph State of hydrograph saved for bookmarking/linking Display upstream basin from NLDI for each monitoring location A number of additional graph server parameters New data services for monitoring locations Brush handles added to monitoring location page hydrograph Based on user feedback, the team upgraded the brush and zoom capability on the hydrograph by adding handles, making it more apparent that the zoom functionality is available and making it easier to use.