
Release Notes for November 13, 2019
A summary of new features and tools released on November 13, 2019
What have we been up to?
This sprint, we have been working on a number of features that are the groundwork for future tools. Most notably, we are developing a working monitoring location services system based on the new Open Geospatial Consortium OGC API-Features standard. In the future, this service will allow users to programmatically access monitoring location geospatial information, including rest-based geospatial querying with rich, human friendly metadata. This service will also allow linking together monitoring locations in collections and networks. Much more on this to come! In the meantime, we did make some small improvements to monitoring location pages.
New features and tools
Monitoring Location pages
More effective display of multiple time series with the same parameter
User Story: As a water manager, I want to be able to choose between different time series that are collected for the same parameter so that I can better understand the state of the river.
It is not uncommon to collect more than one time series with the same parameter code, at a single monitoring location. Often, this is because there are multiple sampling points at the same monitoring location, such as multiple depths in a river. The Potomac River near Washington, D.C. Little Falls Pump Station, for example, collects temperature data at multiple depths. Other times, the type of equipment that was used to collect the data may be sufficiently different that a new time series is created. At times, this can mean quite a few unique time series, such as at Bear Lake in Utah, where a profiler buoy collects water data at 14 different depths, from the surface of the lake to near the bottom. Other sites may collect discharge at multiple parts of a lock and dam complex. On the classic real-time data pages, there is a different graph for each of the time series (e.g, number 420407111201201). On the new pages, we have improved users’ ability to view multiple time series for the same parameter on one graph.
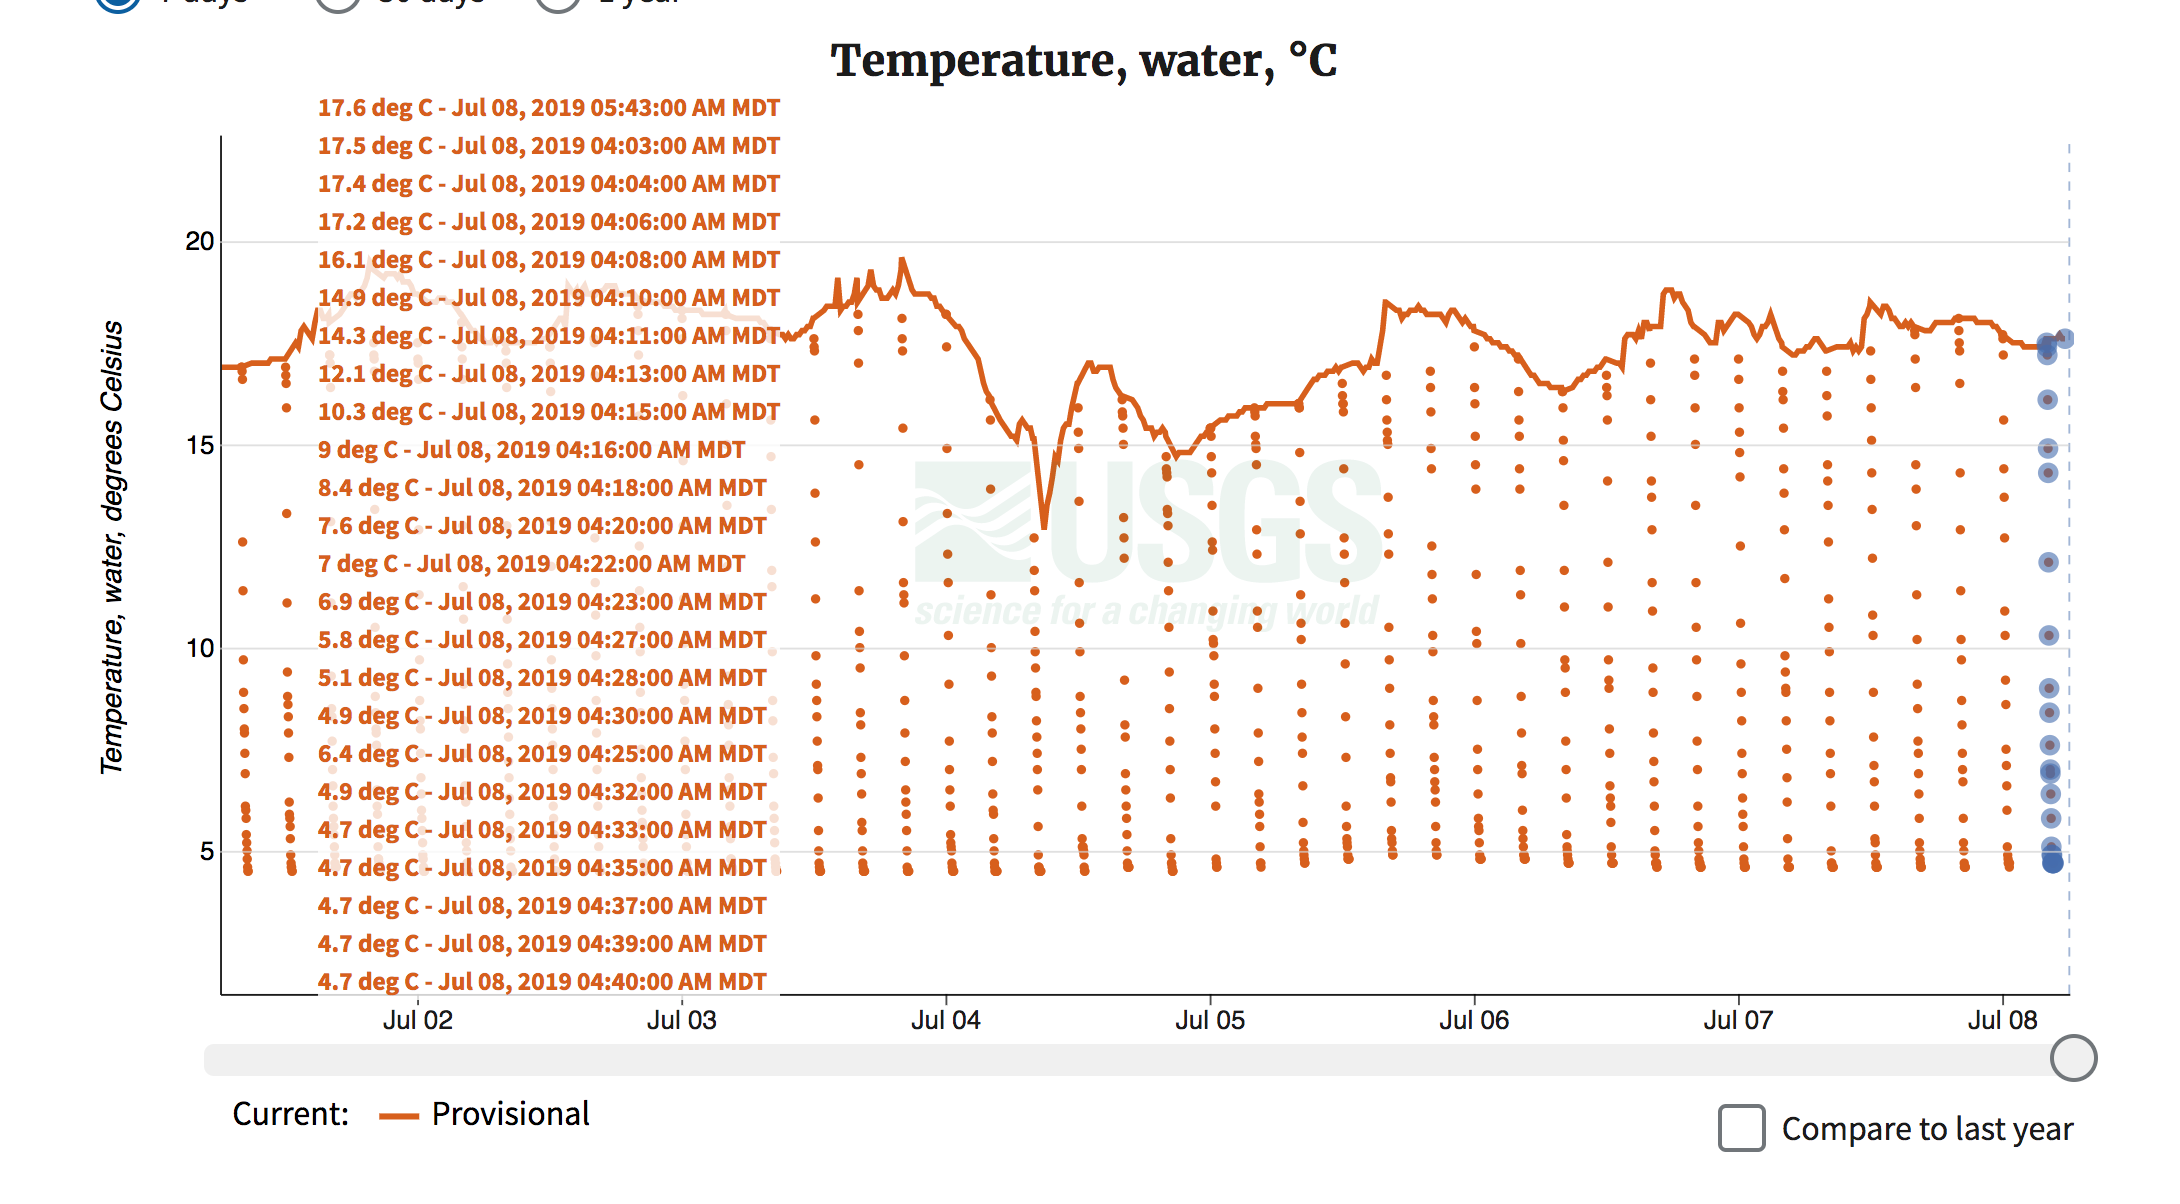
A screenshot showing temperature at monitoring location number 420407111201201, Bear Lake 3.6 miles northeast of Fish Haven, Idaho. There are multiple temperature time series each at different depths of the lake.
To address the some of the shortcomings in the current display (above), this sprint we made some improvements. Now users can interact with the hydrograph to drill into details for one time series at a time. The details for that one time series is displayed in the drop down, but also in the title of the hydrograph. All of these changes make interpretation of the data easier.
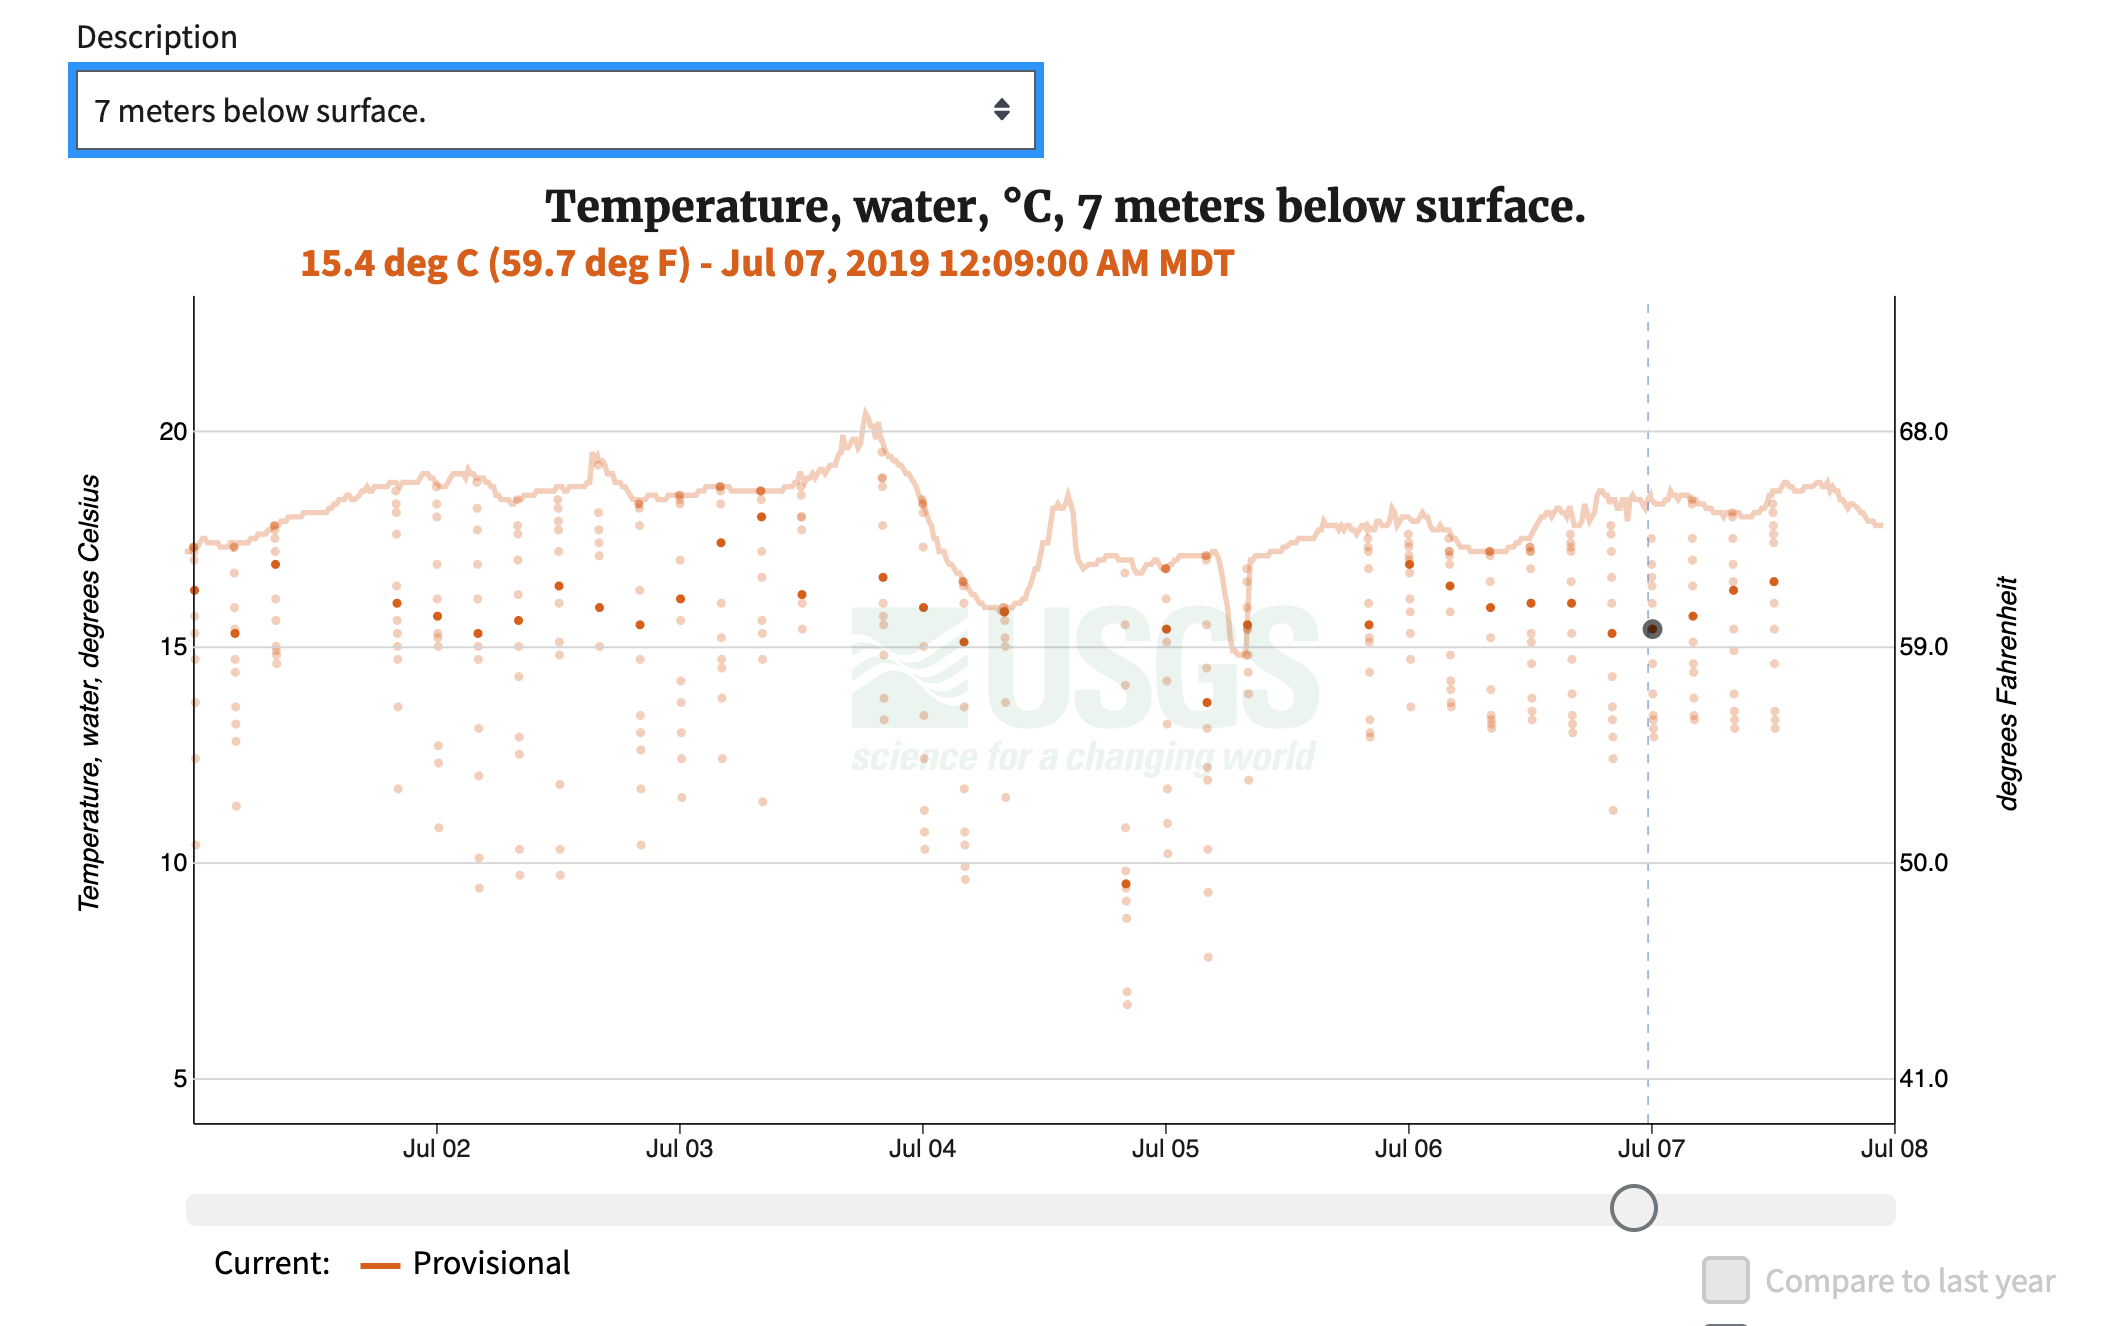
A screenshot showing temperature at monitoring location number 420407111201201, Bear Lake 3.6 miles northeast of Fish Haven, Idaho. A user can now choose a specific temperature time series, in this case seven meters below the surface.
Toggling the median
User story: As a hydrologist, I want to be able to see the median daily average so that I can understand how the current data compares to the past.
The median daily value is a valuable tool to understand if a given instantaneous value is higher or lower than past values. However, it can also be confusing to a user who just wants to understand what is happening right now. Therefore, the median display can be selected by users at the lower right of the hydrograph, rather than displayed all the time.
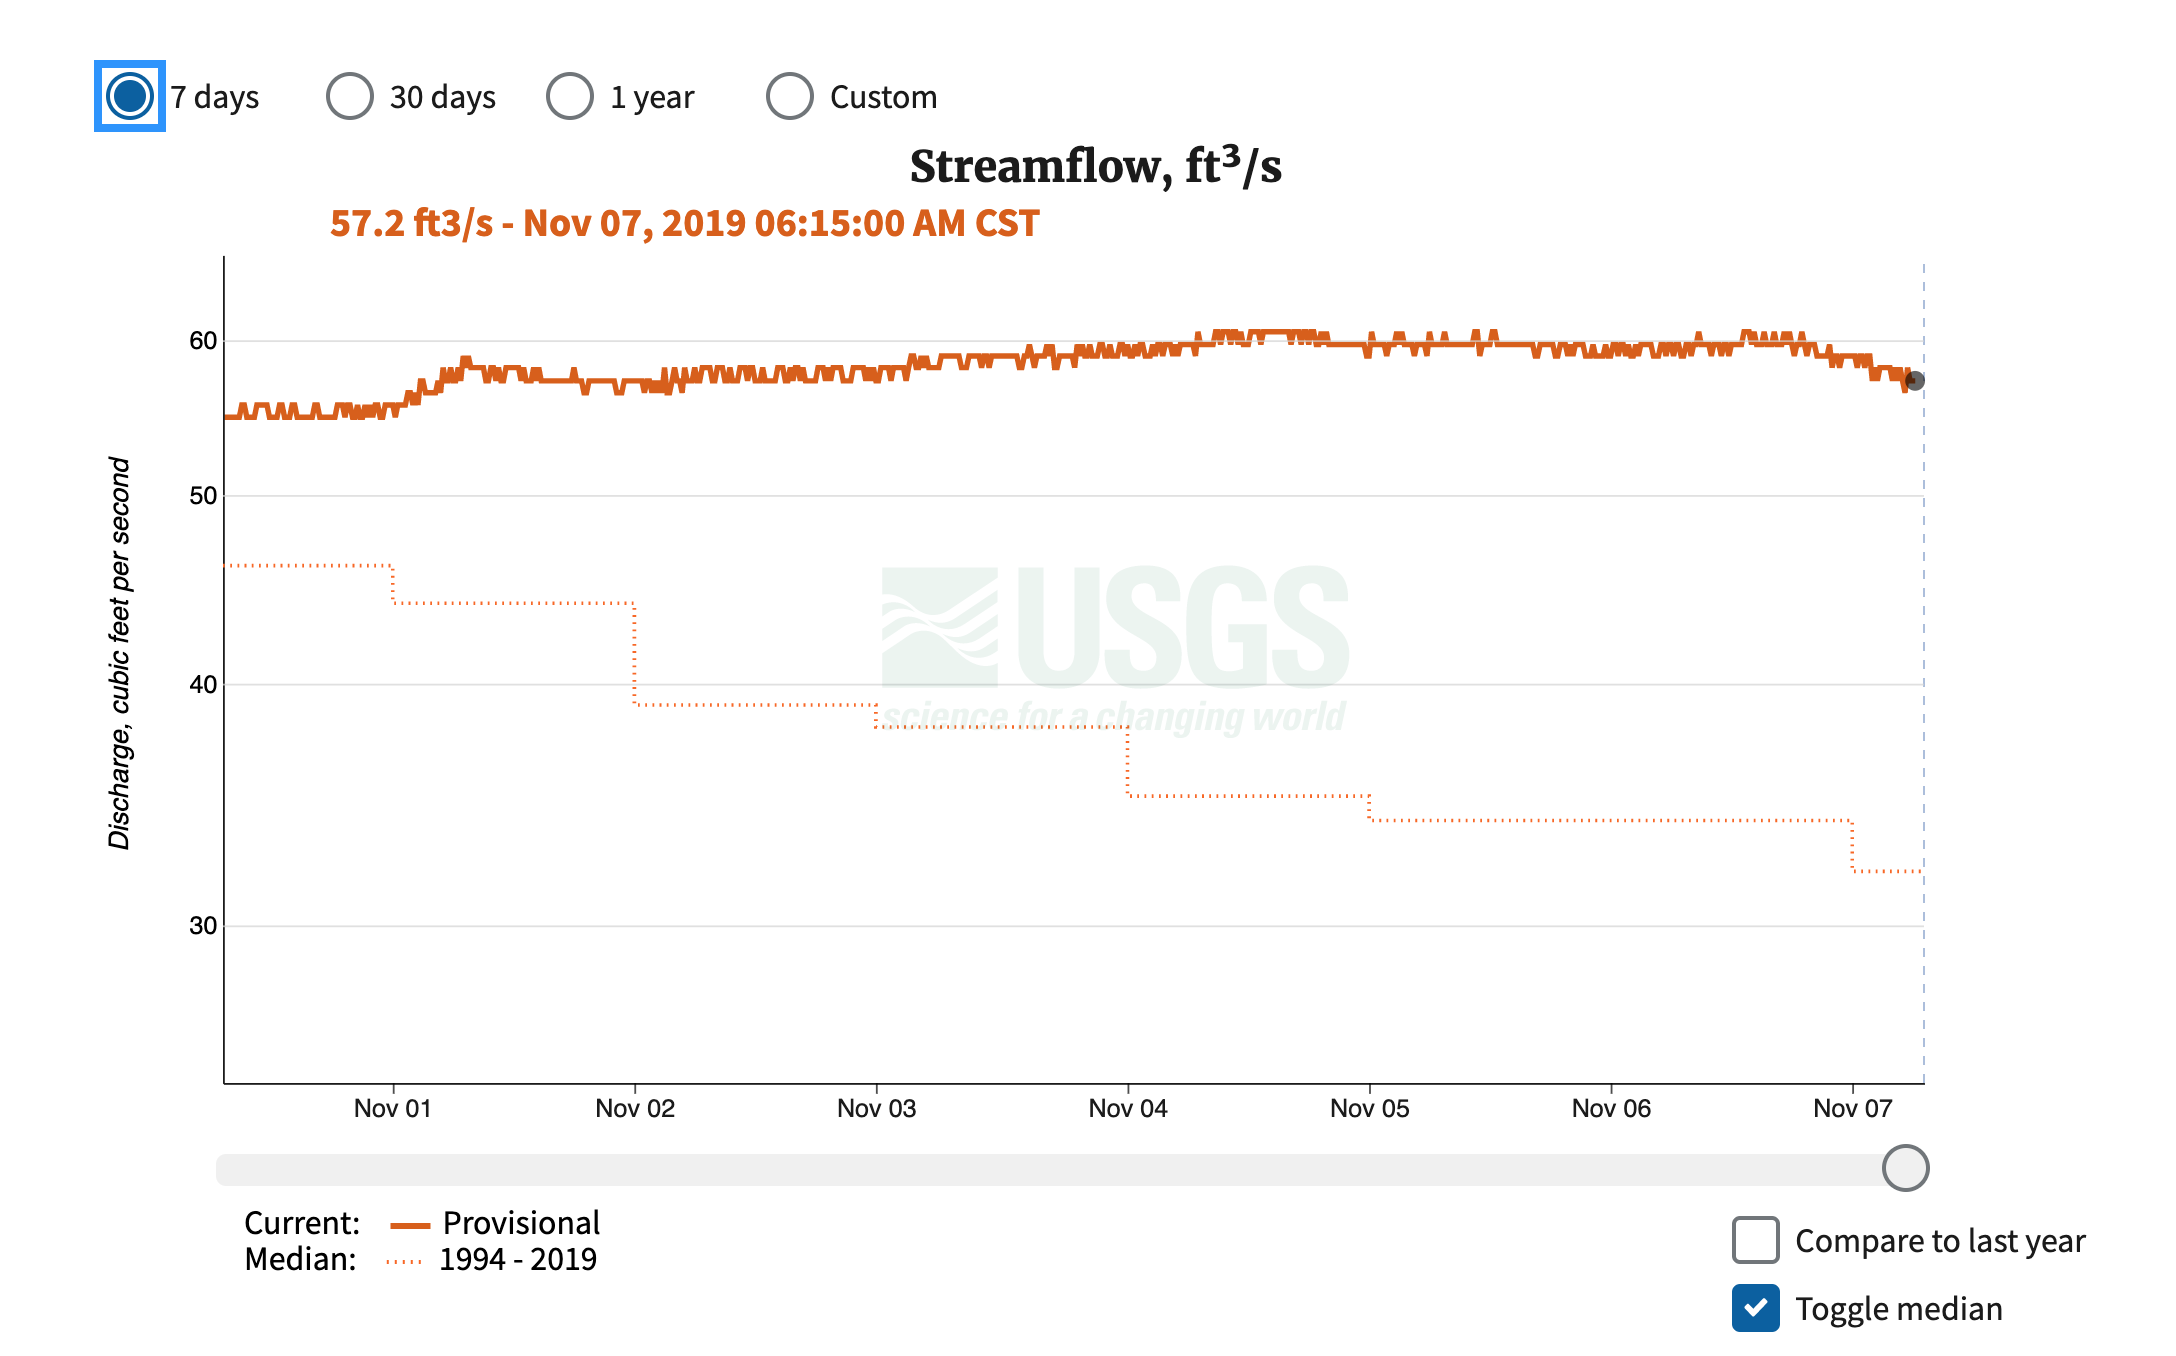
A screenshot showing discharge data at 07144100, L ARKANSAS R NR SEDGWICK, KS. The median data is selected, which shows that the current discharge is higher than the median discharge for historical records of this day of the year.
Monitoring location cameras
Many hundreds of USGS monitoring locations have cameras co-located with other instruments, which add another dimension of data to the data that the USGS collects. We are working on a preliminary solution for putting images and time lapse videos from these cameras on the monitoring location pages. This is an area of significant expansion for the USGS, and we expect quite a bit of additional work on this as we build out the Next Generation Water Observing System (NGWOS). An example location with a camera is on the Yahara River at East Main Street at Madison, WI.
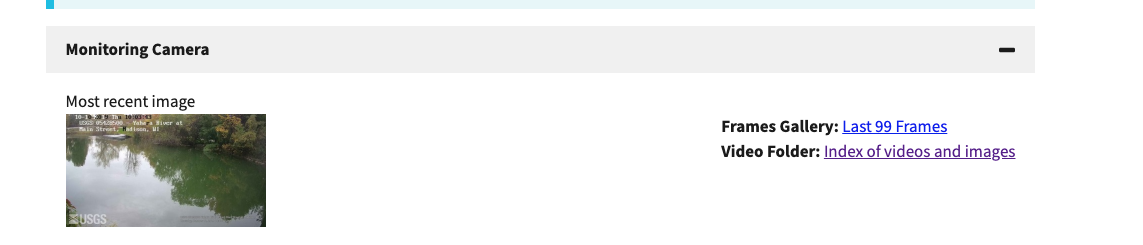
A screenshot from the development version of the new pages, showing a camera that is located at monitoring location number 05428500, Yahara River at East Main Street at Madison, WI
What is coming up for next sprint
Here’s what else you can look forward to next time:
A new monitoring location service based on the Open Geospatial Consortium OGC API-Features standard.
A cloud-hosted Water Quality Portal.
Disclaimer
Any use of trade, firm, or product names is for descriptive purposes only and does not imply endorsement by the U.S. Government.
Categories:
Keywords:
Related Posts
Release Notes for October 16, 2019
October 16, 2019
What have we been up to? This sprint, the team has been working primarily on features that are tied to the cloud version of the USGS Publications Warehouse.
Release Notes for September 25, 2019
September 25, 2019
What have we been up to? This is the first of a series of posts in which newly released features in the Water Data for the Nation family of applications are described.
Release Notes for July 21st, 2020
July 21, 2020
What have we been up to? Pubs Warehouse moved to the Cloud Behind the scenes work New features and tools Pubs Warehouse on the Cloud The Water Data for the Nation team is the primary development team for another high profile application, the USGS Publications Warehouse.
Release Notes for late March 2020
April 10, 2020
What have we been up to? Image server work Period parameter Axis scaling Networks page New features and tools Image export from monitoring location pages One of the most requested features we receive from users is the ability to export images from the monitoring location pages.
Release Notes for late February and early March 2020
March 20, 2020
What have we been up to? Added handles to brush on the monitoring location page hydrograph State of hydrograph saved for bookmarking/linking Display upstream basin from NLDI for each monitoring location A number of additional graph server parameters New data services for monitoring locations Brush handles added to monitoring location page hydrograph Based on user feedback, the team upgraded the brush and zoom capability on the hydrograph by adding handles, making it more apparent that the zoom functionality is available and making it easier to use.