
Spring 2021 Water Data for the Nation release notes
An update of next-gen monitoring location page features released in early Spring 2021, including major usability improvements.
What have we been up to?
Adding temperature in Fahrenheit
Updating user feedback options
Making WDFN more usable
New features and tools
Temperature available in Fahrenheit
Historically, USGS has taken temperature data in degrees Celsius. Users have asked for a way to compare the data to a Fahrenheit scale over the years and for the first time, a new option exists to support that request. Now a separate parameter is available to show a calculated conversion of the temperature data to degrees Fahrenheit on the hydrograph. The underlying data remains the degrees Celsius, with a conversion applied to allow for easy hydrograph analysis in degrees Fahrenheit.

Water temperature parameters in the Parameter Selection Table, showing the new option for Temperature, water, degrees Fahrenheit (calculated) at Little Arkansas River near Sedgewick, KS
Updated our user feedback options
As more of our users are utilizing the updated monitoring location pages, we have increasingly been receiving more user questions and comments about the data itself, which we strive to respond to in a timely manner. To that end we have updated the user feedback form to allow the user to specify why they are reaching out to the USGS. If a user is contacting us with questions or concerns about the data at the location, this is forwarded directly to the USGS staff that interacts with the sensor, helping to streamline the USGS response.
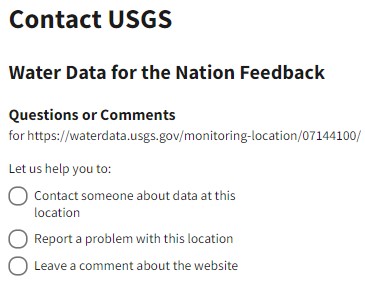
Contact USGS form , zoomed into the options of type of feedback: data questions, reporting problems, or leaving a comment.
Updating the Parameter Selection Table
As we continue to update the interactive options around parameters, we had hit the limit of what we could associate with Parameter Selection Table. The Parameter Selection Table, used to review and select the data that is shown on the hydrograph, was too wide for mobile without a scrollbar. To address this mobile concern, and allow us for growth in the future, we updated the Parameter Selection Table to be simplified with only the parameter name and period of record shown by default. Each parameter is now able to be expanded using a carrot on the right of the row to view additional information about the parameter. For now, data subscription is the only thing available in the expanded row, but the contents will expand over time, stay tuned for more updates to this feature!
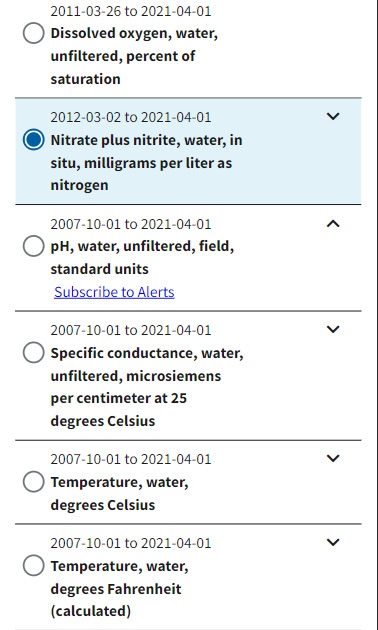
Subset of the Parameter Selection Table on mobile at Little Arkansas River near Sedgewick, KS
Striving to make the page more usable
We were excited to have the opportunity to test with our users and better understand how the site is working for their needs. For our first test, we set out to learn the following information from our users:
Can users understand the data displayed?
Can users download data?
Can users find other nearby monitoring locations?
Can users provide feedback?
As we watched our users use our page, we identified many places where we could add features to make our interface more intuitive. We are continuing to iterate on these changes and will be checking back in with our users soon, but let’s cover some of the major updates to the user interface.
Clarifying what it means when no data loads on the hydrograph
In many cases, a user will select data to be displayed on the hydrograph and is surprised by a hydrograph that is blank. With no supporting information, the users were not sure whether data existed or whether they had configured the graph incorrectly.
When a longer time frame of data is requested to be displayed on the hydrograph, there can be a noticeable delay before the data is rendered on the graph. A loading indicator is now drawn on the graph while the data is loading to ensure our users know the request is being processed and the hydrograph is not complete yet.
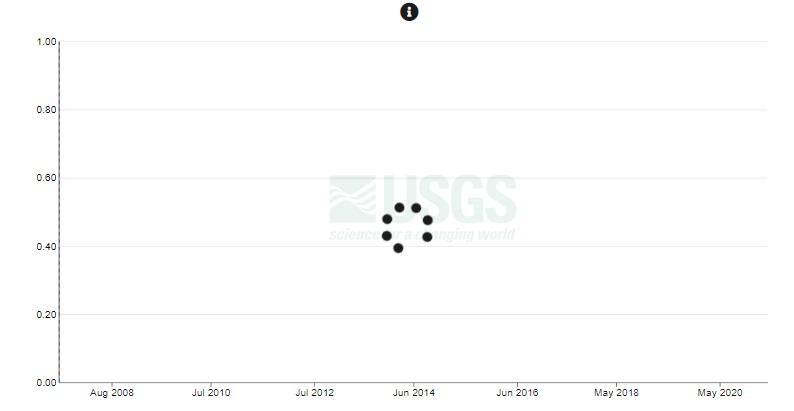
Hydrograph loading data with a loading indicator over the top of the page
If there is no data in the given time range, clear messages are now provided on the hydrograph explaining what data was not found. In the case that none of the data requested is available, a clear message of “No data available” is written onto the hydrograph.
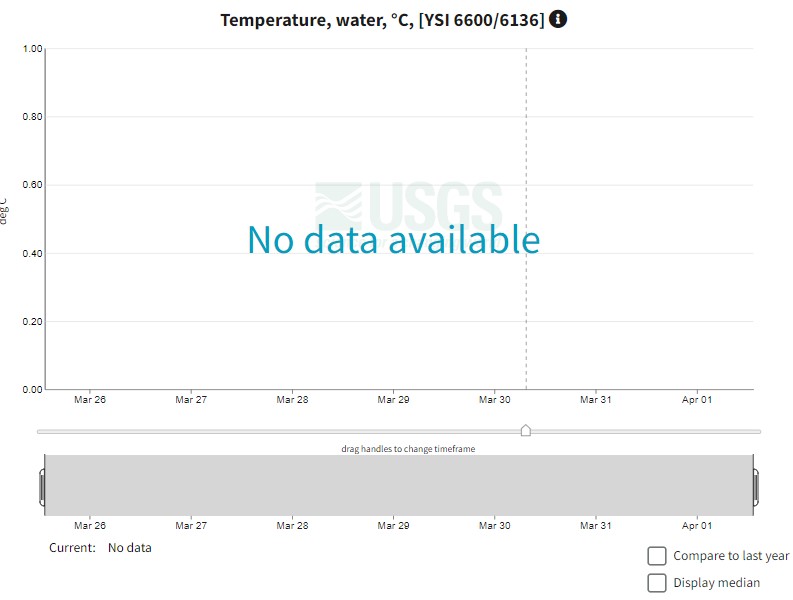
Hydrograph with no data available
The legend is used to clarify which data is missing when multiple parameters or statistics are simultaneously rendered. In this example, only the median data was found for this sensor, with the legend clarifying that both current and last year’s data was not available for this parameter.
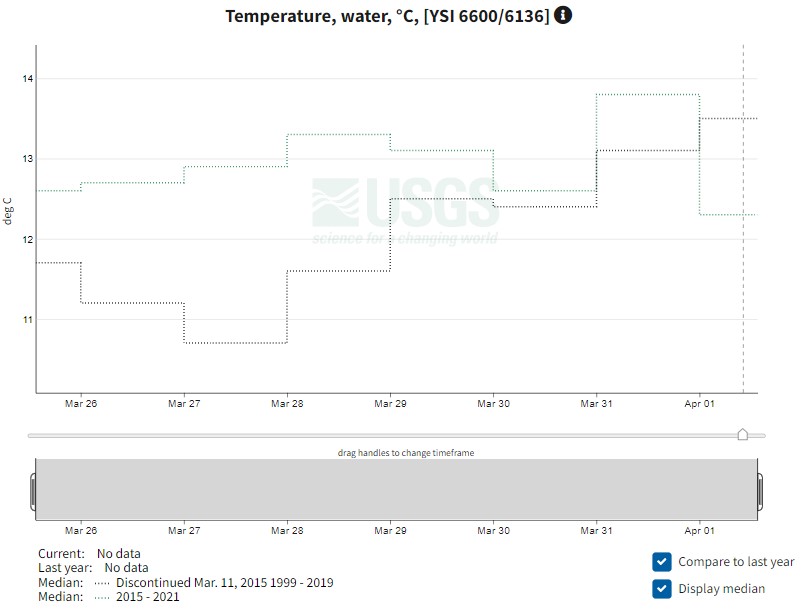
Hydrograph of water temperature at Little Arkansas River near Sedgewick, KS for a sensor that has no data during the selected time frame, but median data is rendered on the hydrograph.
Retrieving data
Users have asked for clear ways to download the data shown on the hydrograph. The team is working behind the scenes to make an easy to use download for all types of NWIS data but while we have been waiting for that functionality, we provided access to the existing water services tab-separated data to fill the gap. Originally, these links were available in a tab midway down the page, but when we worked with our users, we found that it was confusing and many users start their search for this functionality near the hydrograph.
As a result, we moved and clarified the functionality to be associated in a tab above the hydrograph. When the “Retrieve data” button is pressed, a drop-down menu opens with option to retrieve any data displayed on the hydrograph. The data is opened in a new html tab when the Retrieve button is pressed. We will continue to review whether this interface works for our users and will iterate as we find easier ways to help our users access the data.
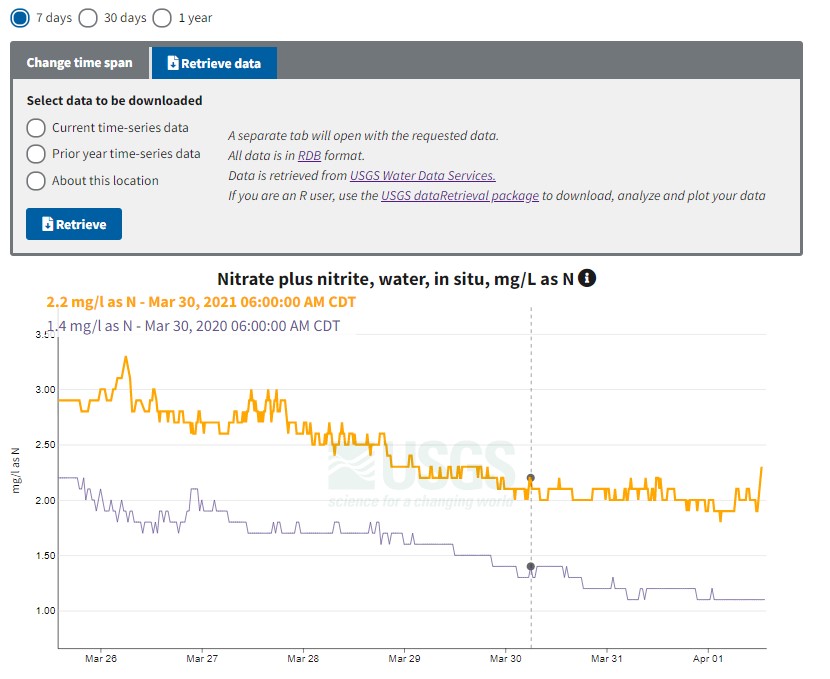
Retrieve data tab is open showing the available data options and the context of the data service at Little Arkansas River near Sedgewick, KS
Changing the time span
One of the most popular interactions with the hydrograph is to change the time span. During our testing with users, we found that the custom time span was not as easy or obvious to use as we had intended. Not all our users use this custom feature regularly, as the pre-built 7 days / 30 days / 1 year options fulfils the needs of many of our users. The custom options were moved into a standalone tab (along with the Retrieve data functionality) and simplified to allow users to clearly see either the calendar selection or the days before that could be adjusted manually. When the Change time span button is pressed, a drop-down menu appears with the custom time options. The changes are not applied to the hydrograph until the Change time span button is pressed. As with the Retrieve data, we will continue to review whether this interface works for our users and will iterate as we find easier ways to help our users access the interaction.
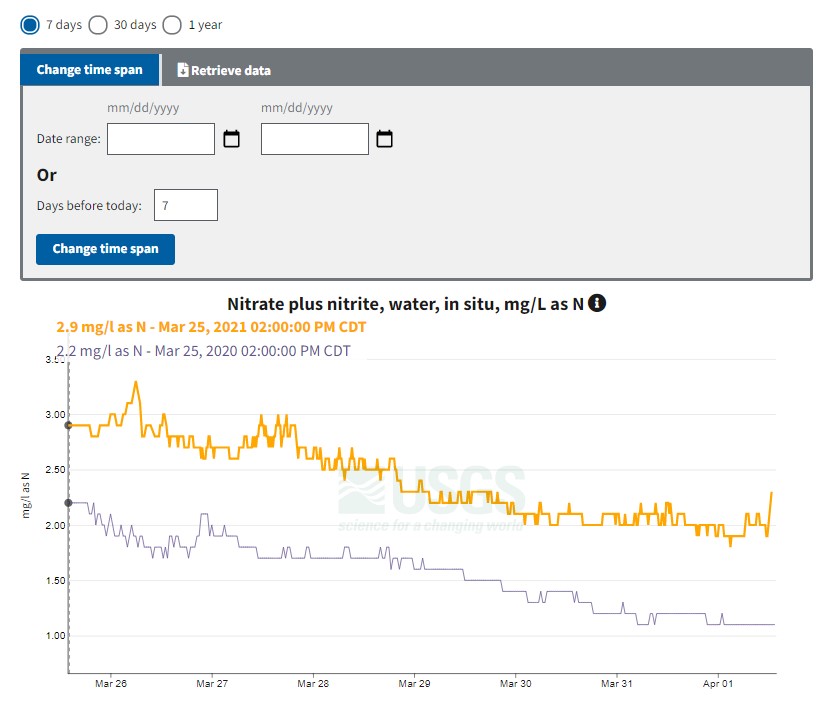
Change time span tab is open showing options to change time by calendar or by days prior Little Arkansas River near Sedgewick, KS
Behind the scenes
Increased hydrograph rendering performance
For data with multiple methods of measurement, ensured the page automatically selects the method with the most data in the selected time span
Camera now uses html5 video when possible
Added Beta tags for Groundwater Data and Affiliated Networks sections to indicate the maturity of these features.
What is coming up for next sprint?
Continuing to work on enhancing the usability of the pages,
Testing with users to better understand how key features are used
Disclaimer
Any use of trade, firm, or product names is for descriptive purposes only and does not imply endorsement by the U.S. Government.
Categories:
Keywords:
Related Posts
Improving Monitoring Pages with User Feedback
January 12, 2021
User feedback is a vital part of our design process. We’ve asked users to provide feedback on our next-gen monitoring location pages and they’ve submitted some great ideas!
#5NewThings
August 21, 2020
The Water Resources Mission Area is spotlighting five newly available features on our next-gen monitoring location pages this week! To compliment this blog post, we will show off our work on Instagram and Twitter, using the hashtag #5NewThings.
Water Quality Data Delivery Listening Sessions
July 28, 2020
Water Quality Data Delivery Listening Sessions Starting on August 3, 2020, the WDFN Team will be conducting a month of activities aimed at gathering input from both internal and external users to help guide development activities related to water-quality data delivery.
Decommissioning of the National Water Census - Data Portal
July 22, 2020
What are you decommissioning? As the USGS Water Mission Area (WMA) undertakes modernizing data delivery as part of implementation of the U.S. Geological Survey Water Science Strategy (Circular 1382-G ), resources will be directed away from legacy applications to new development and delivery mechanisms.
Release Notes for July 21st, 2020
July 21, 2020
What have we been up to? Pubs Warehouse moved to the Cloud Behind the scenes work New features and tools Pubs Warehouse on the Cloud The Water Data for the Nation team is the primary development team for another high profile application, the USGS Publications Warehouse .