
The case for reproducibility
Explanation of reproducibility and resources to start practicing it
Science is hard. Why make it harder?
Scientists and researchers spend a lot of time on data preparation and analysis, and some of these analyses are quite computationally intensive. The amount of time required to conduct an analysis grows for the increased complexity of calculations, amount of data, and number of datasets that will be analyzed. Many researchers use spreadsheets to conduct their analysis workflows, and apply the same tasks to each data set manually. A majority of the time in this type of workflow could be spent copying and pasting equations from one spreadsheet or column to another.
What if I told you there was a better way?
By focusing on reproducibility from the start of a project, you can quickly re-run analyses, easily share your methods with colleagues and collaborators, apply the same methods to multiple datasets with little effort, and reduce errors.
What does “reproducibility” really mean?
The term “reproducibility” is referring to the ability for your work to be easily recreated by others, and your future self. You should be able to send one or two files and a few instructions for completing your analysis. There shouldn’t be a laundry list of items to change, necessary directories, or old versions of software required.
The best way to accomplish reproducibility is to start scripting your analyses. Scripting is the practice of writing code to a file in order to perform a certain task or calculation. Rather than producing “one-off” anlayses, script your work so you can reference the exact method in the future, re-run the same method for other data, and easily share your processes with colleagues, collaborators, and the public. Any scripting language will do; however, USGS Water is using R.
Tips and tricks to having reproducible workflows
- script your work!
- comment the steps in your code
- use relative (not absolute) filepaths
- limit the number of applications/programs being used when possible
- keep up to date with software versions
What can you do?
If you don’t know where to start, try learning some basic R. There are many resources: tryR from Code School , swirl , and the USGS Introduction to R Course.
Next, try to script just one piece of your analysis. Pick a set of tasks that need to be applied to several similar datasets or need to be run repeatedly. Write a script that automates one iteration through those tasks. Then reduce your analysis time and mistakes by applying that same script to all of the datasets or runs. Better still, move your code into a loop so that the script automates the repetition, too.
Reproducibility can go beyond your local files. Maybe your plots and tables are scripted, but you’re still having to copy and paste into slides or a manuscript. R Markdown can automate the process of inserting figures and tables into PDFs, Word documents, and slides.
Shuffling around files between contributors and peer reviewers is time consuming and can get confusing quickly. Version control is a way to avoid this mess - it tracks every deletion, every addition, and every contributor that interacts with your code. It is especially useful when there are multiple contributors because you never have to pass around files at varying stages through email. In fact, this post is created using version control. Our group uses Git and GitHub as version control tools, but that’s not the only choice.
And finally, encourage colleagues and collaborators to strive for reproducible science!
In conclusion…
Watch this video on the “horrors” of non-reproducible workflows by Ignasi Bartomeus and Francisco Rodríguez-Sánchez.
Categories:
Related Posts
Using the dataRetrieval Stats Service
October 5, 2016
Introduction
This script utilizes the new
dataRetrievalpackage access to the USGS Statistics Web Service . We will be pulling daily mean data using the daily value service inreadNWISdata, and using the stats service data to put it in the context of the site’s history. Here we are retrieving data for July 12th in the Upper Midwest, where a major storm system had recently passed through. You can modify this script to look at other areas and dates simply by modifying thestatesandstorm.dateobjects.A map that glows with the vocabulary of water
February 27, 2026
English is the official language and authoritative version of all federal information.
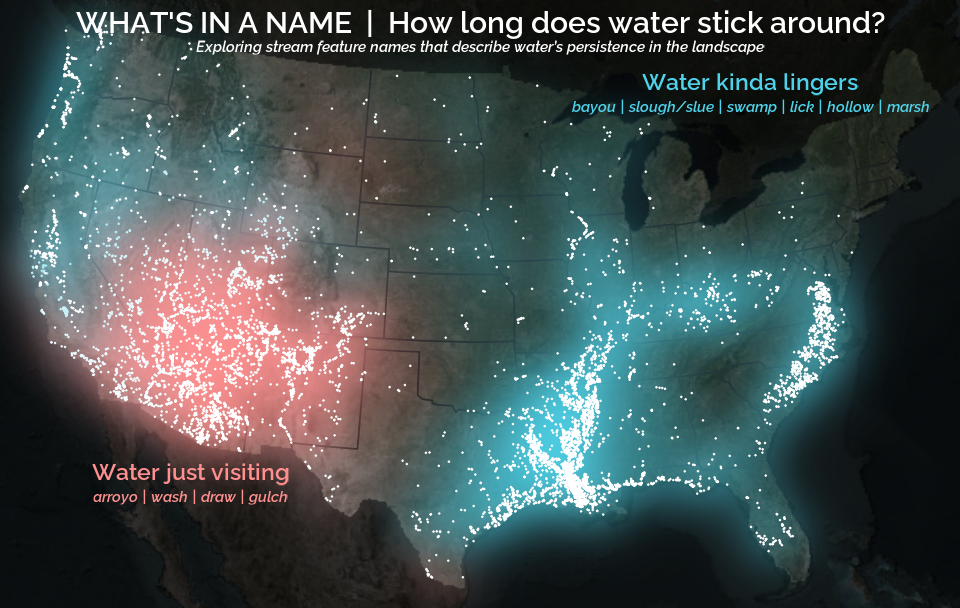
A map that glows with the vocabulary of water
What is your first impression of the map above? To me, it is the shimmer. Thousands of points of light, each one a stream or river, illuminating a darkened basemap. Look closely and a pattern emerges: the country’s waterways form a linguistic constellation. These points are classified not from population data or even explicitly by hydrology. They glow strictly according to the vocabulary used to name them and what can be implied about the hydrology of these streams based on their names.
Extracting the grammar of U.S. stream names
February 27, 2026
English is the official language and authoritative version of all federal information.
Extracting a stream’s feature
The names of streams (hydronyms ) contain, hidden within them, the power to show us the linguistic patterns within the United States. In the United States, stream names tend to follow a binomial structure: a specific name (“Moose,” “Columbia,” “Snake”) paired with a generic feature word (“creek,” “river,” “fork,” “bayou”). The specific portion is endlessly variable, but the generic part is surprisingly stable. In fact, if you look at stream names across the country, the diversity of generic terms is relatively small, but shaped by centuries of hydrologic realities, settlement history, and local tradition.
Easy hydrology mapping with nhdplusTools, geoconnex, and ggplot2
November 28, 2025
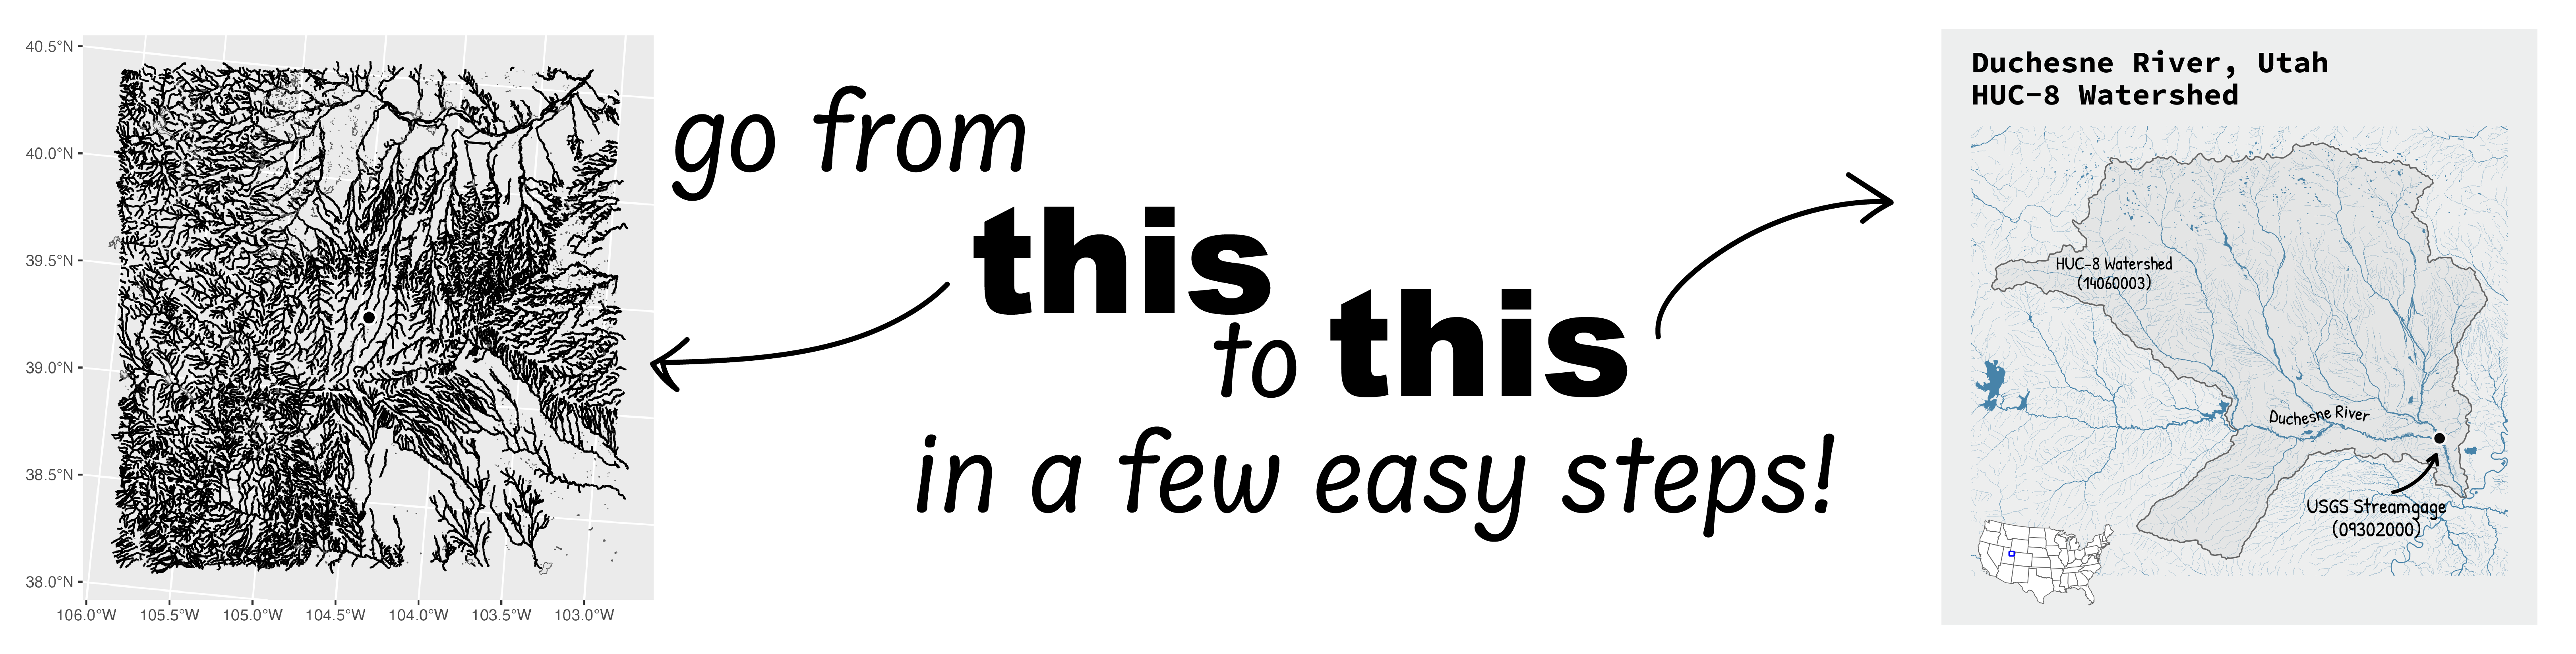
Go from hard-to-read default visuals to easy-to-read river maps in a few easy steps!
Tutorial of dataRetrieval's newest features in R
November 26, 2025
This article will describe the R-package
dataRetrieval, which simplifies the process of finding and retrieving water from the U.S. Geological Survey (USGS) and other agencies. We have recently released a new version ofdataRetrievalto work with the modernized Water Data APIs . The new version ofdataRetrievalhas several benefits for new and existing users: