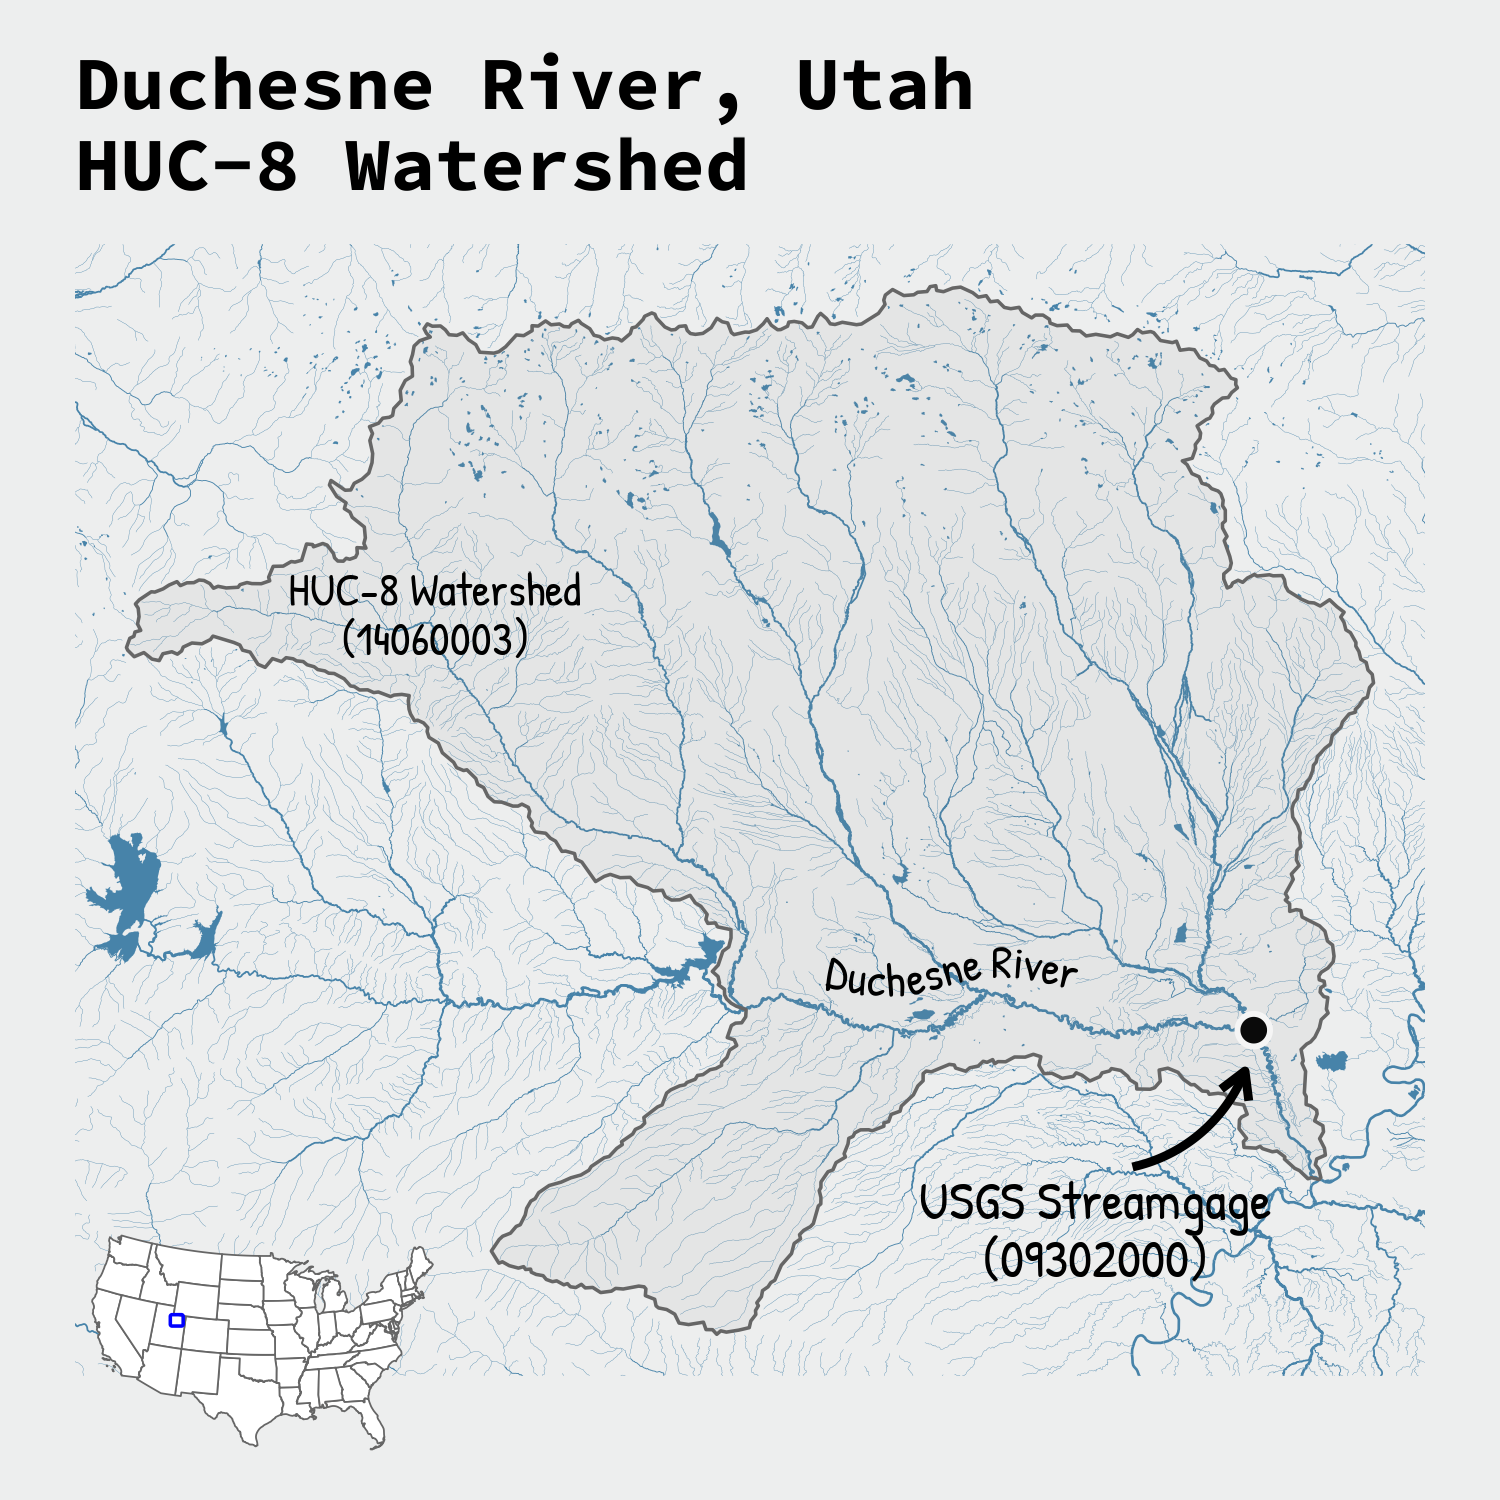
Plotting hydrography data has never been easier with the latest versions of nhdplusTools and ggplot2. This blog demonstrates how to fetch and map National Hydrography Dataset (NHD) rivers and waterbodies with several reproducible examples.

Plotting hydrography data has never been easier with the latest versions of nhdplusTools and ggplot2. This blog demonstrates how to fetch and map National Hydrography Dataset (NHD) rivers and waterbodies with several reproducible examples.

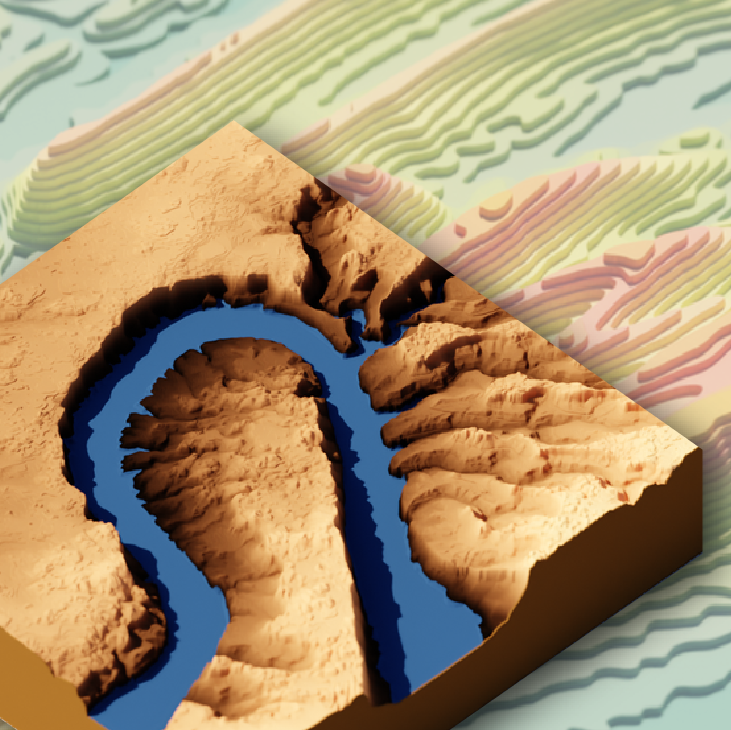
Reproducible workflows that provide the data and tools for you to get started making your own 3D graphics of topographic, satellite, and water data

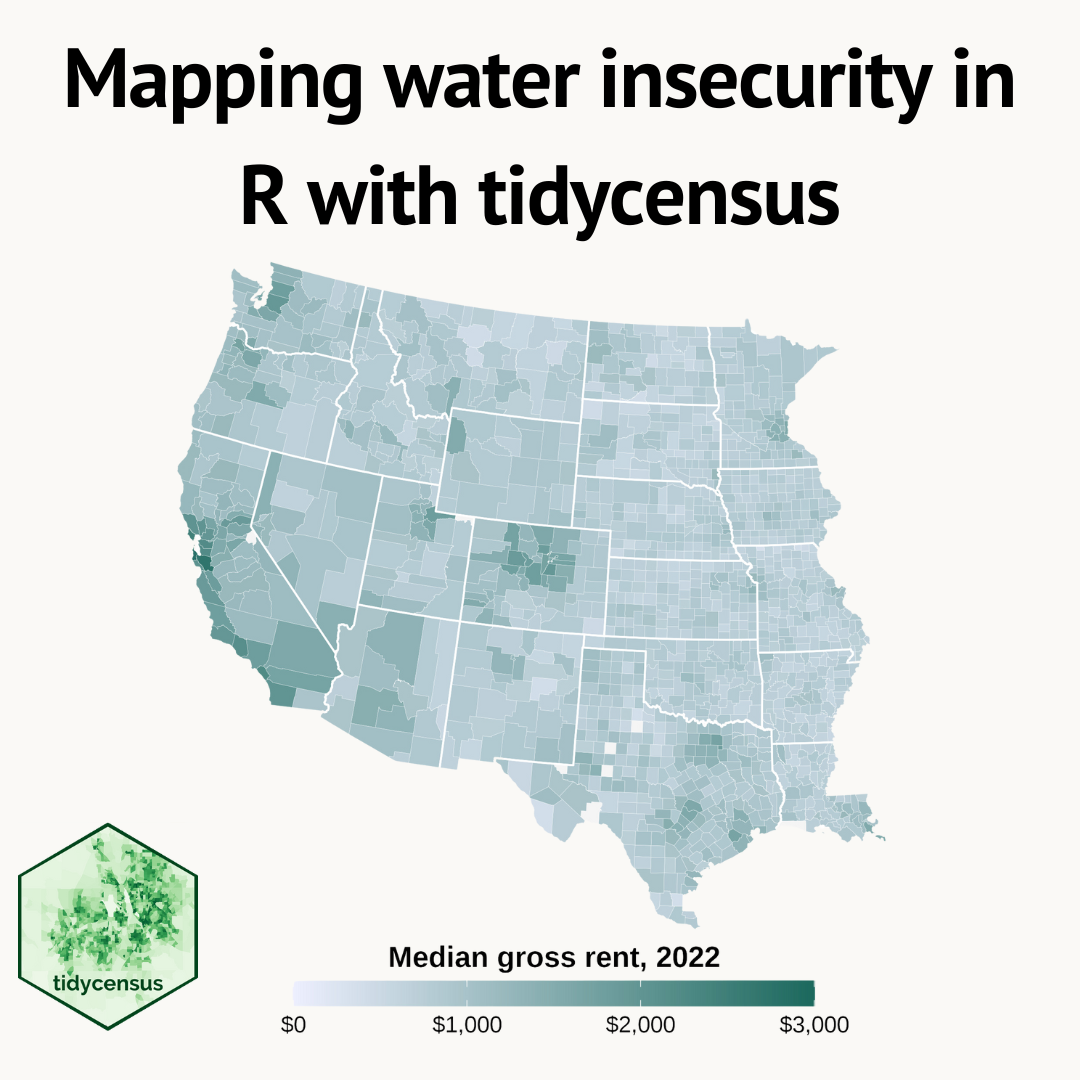
This blog shows several different ways to visualize data from the tidycensus package for R.

Using the tidycensus package to access and visualize American Community Survey (ACS) data.

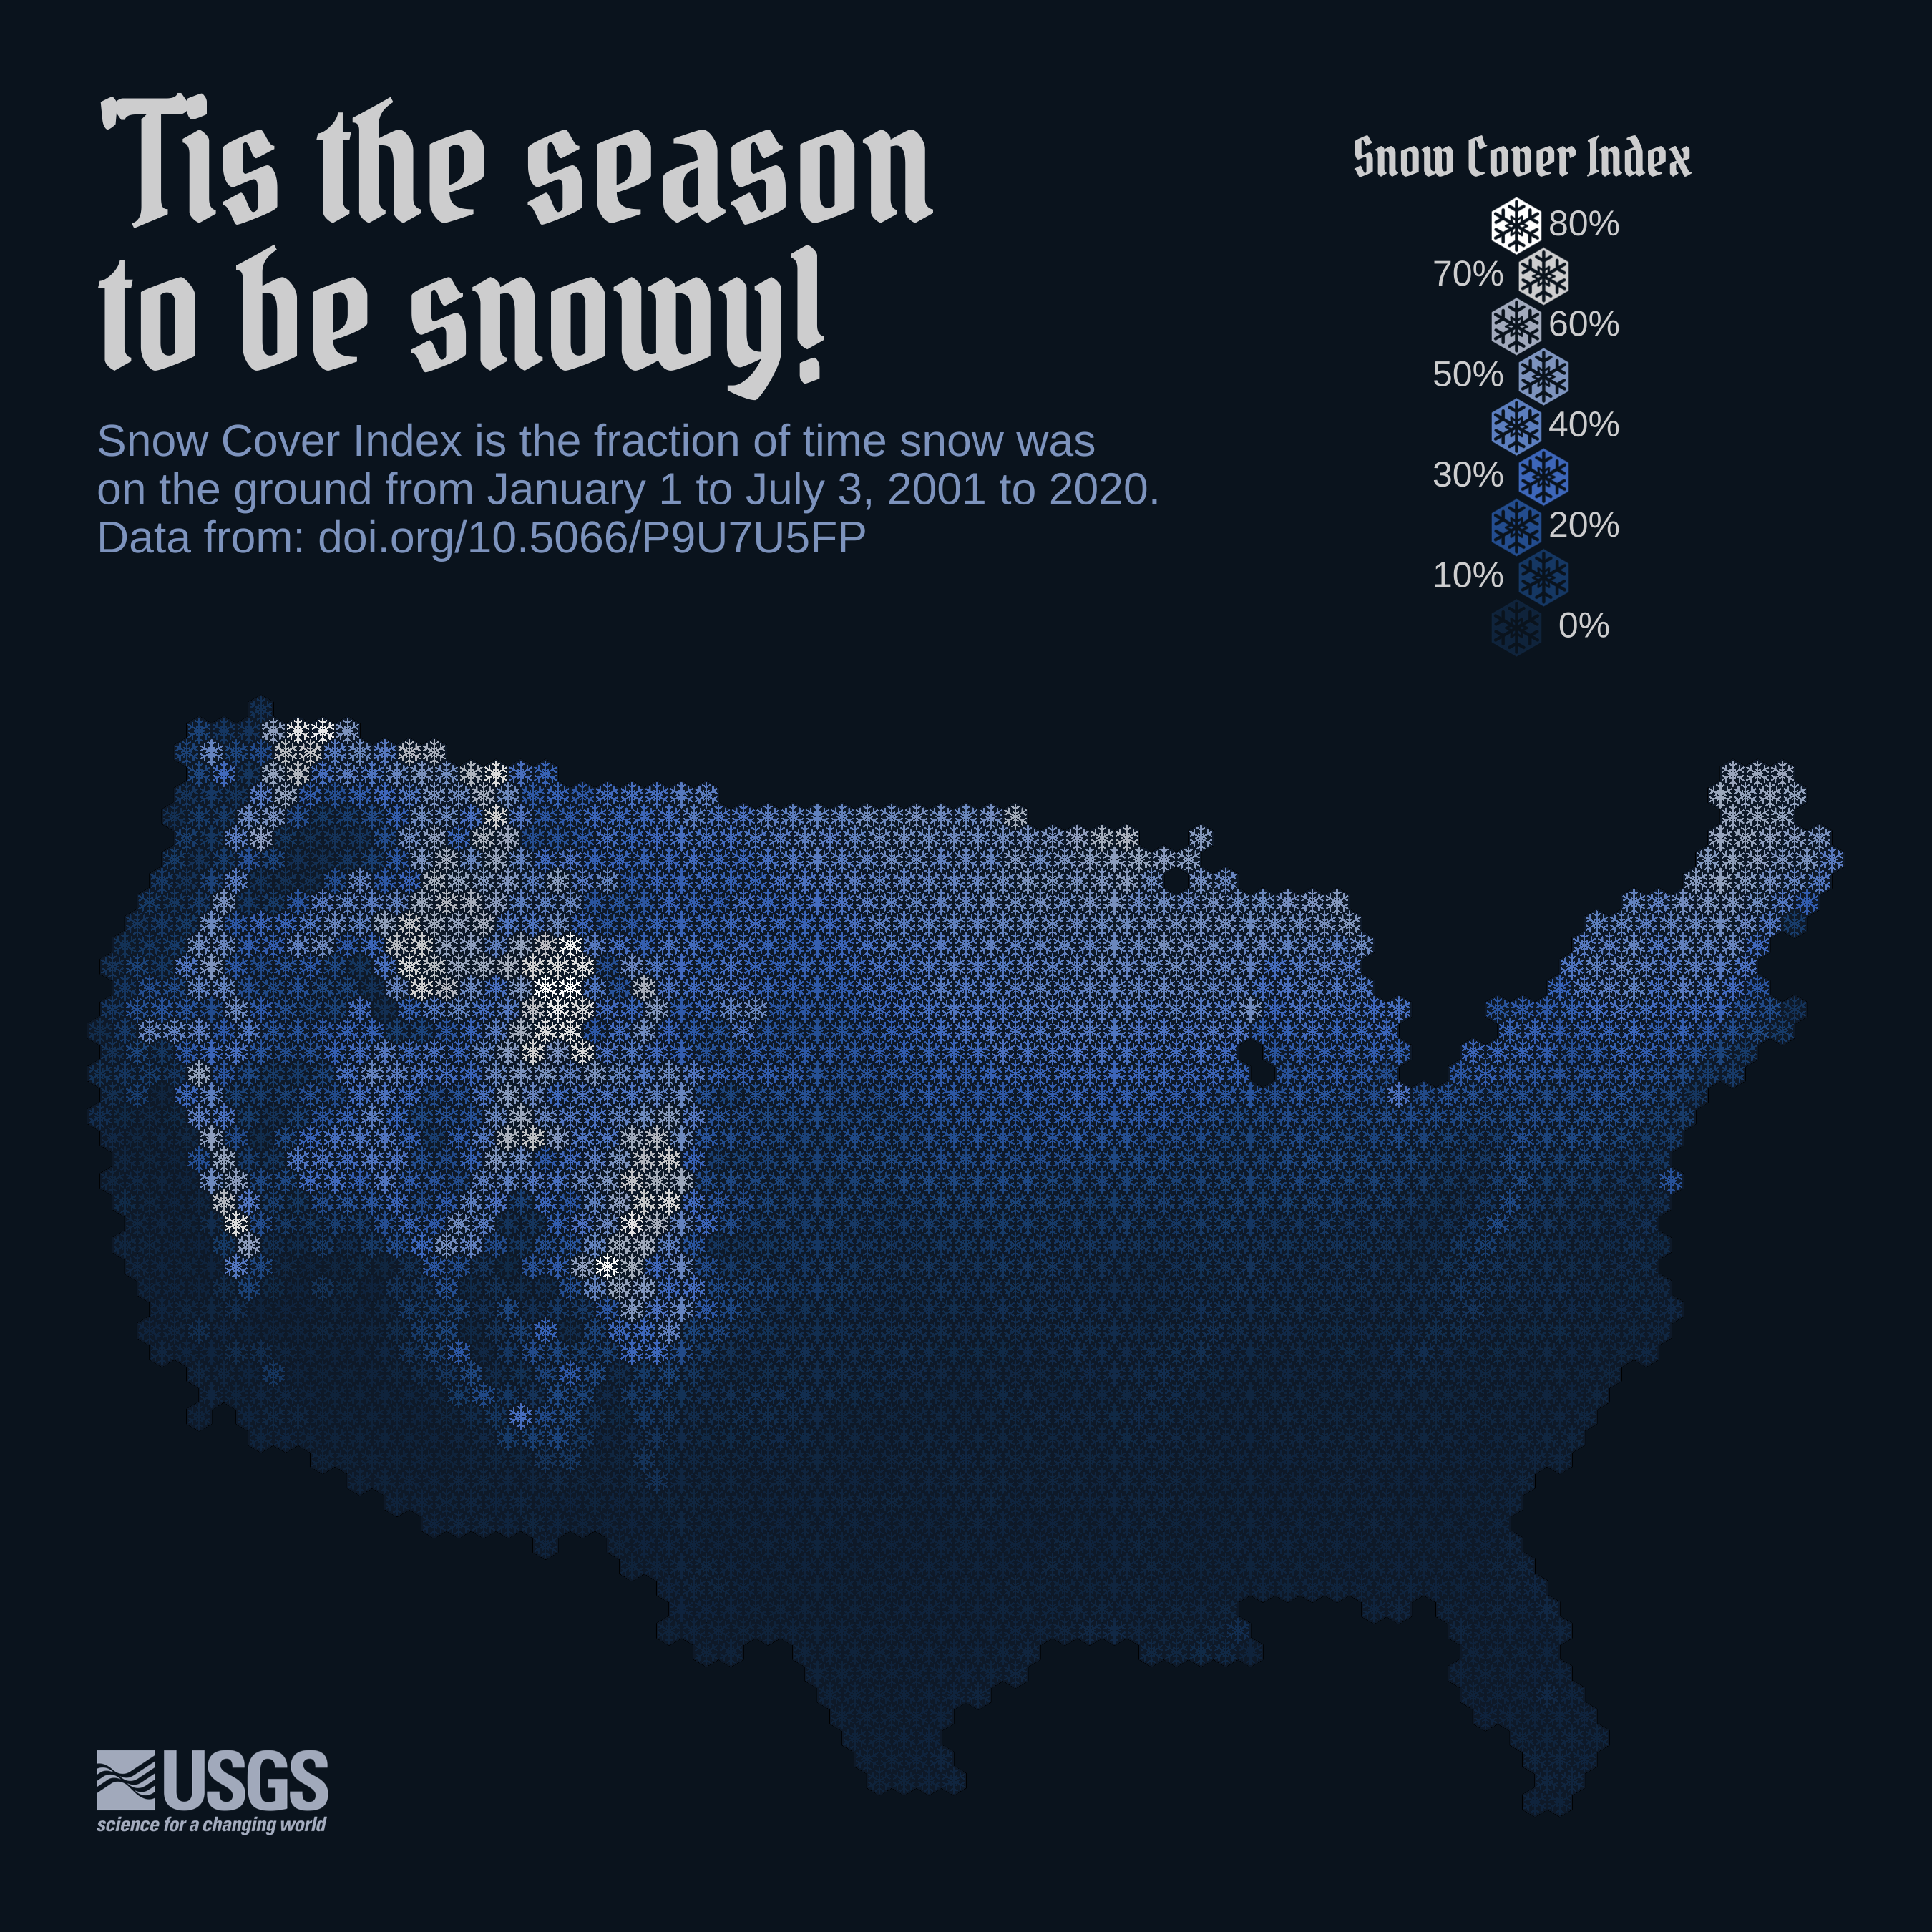
Reproducible code demonstrating the evolution of a recent data viz of CONUS snow cover