Introduction to HASP package for groundwater data.
Official websites use .gov
A .gov website belongs to an official government organization in the
United States.
Secure .gov websites use HTTPS
A lock (
) or https:// means you’ve safely connected to the .gov website. Share
sensitive information only on official, secure websites.
Introduction to HASP package for groundwater data.
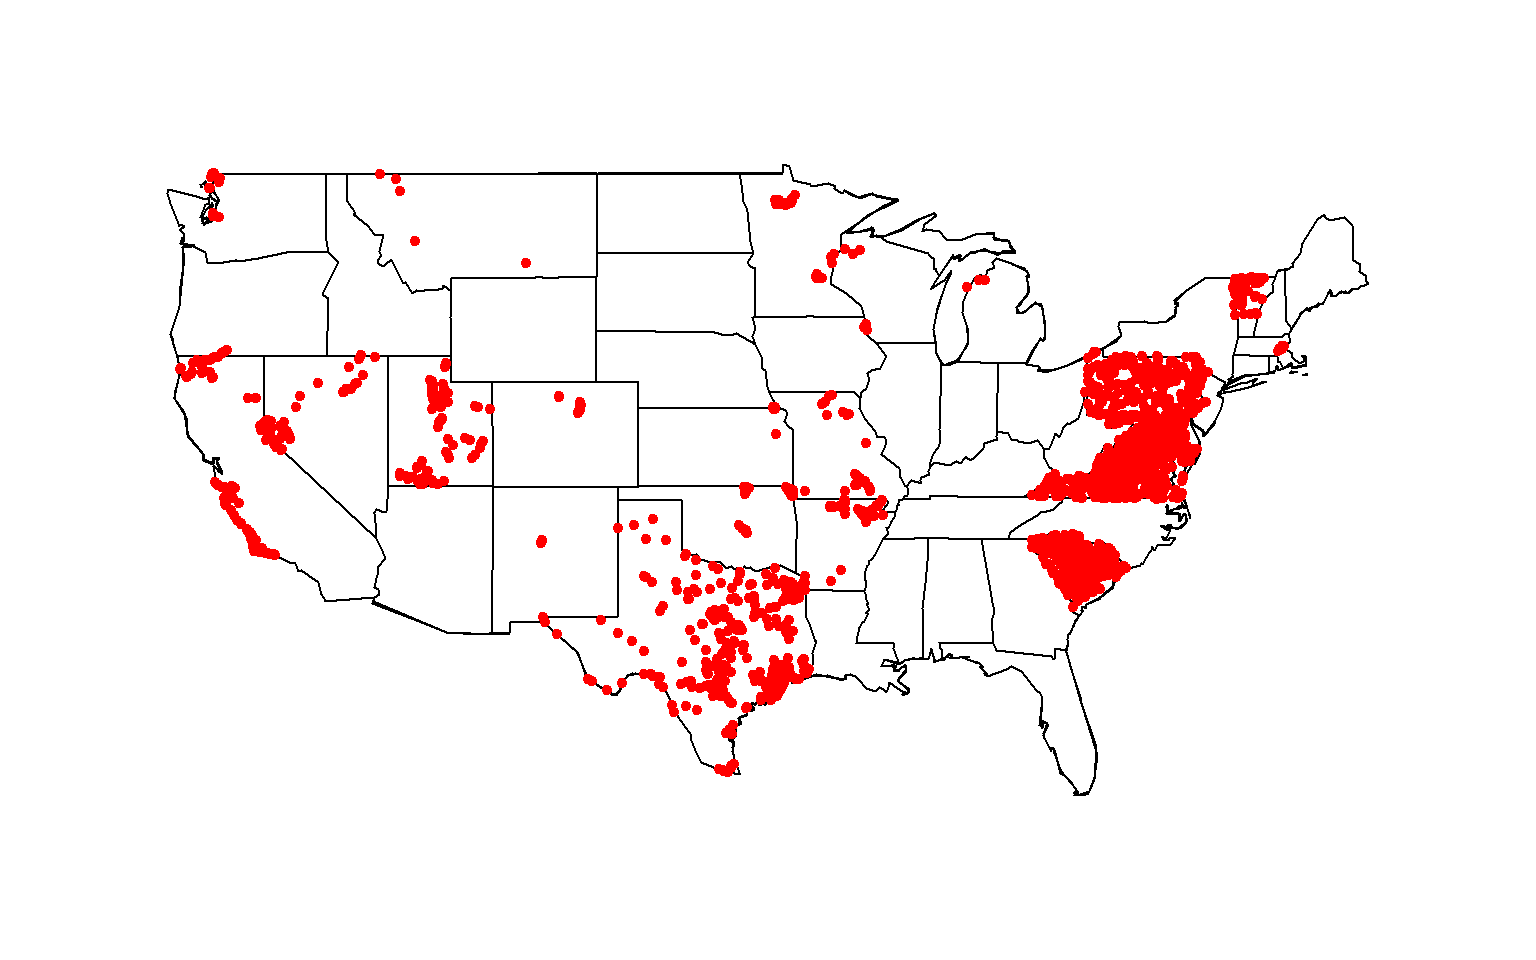
Large pull for all total nitrogen data for streams in the contiguous United States with sites that have at least 40 measurements between 1995 and 2020.
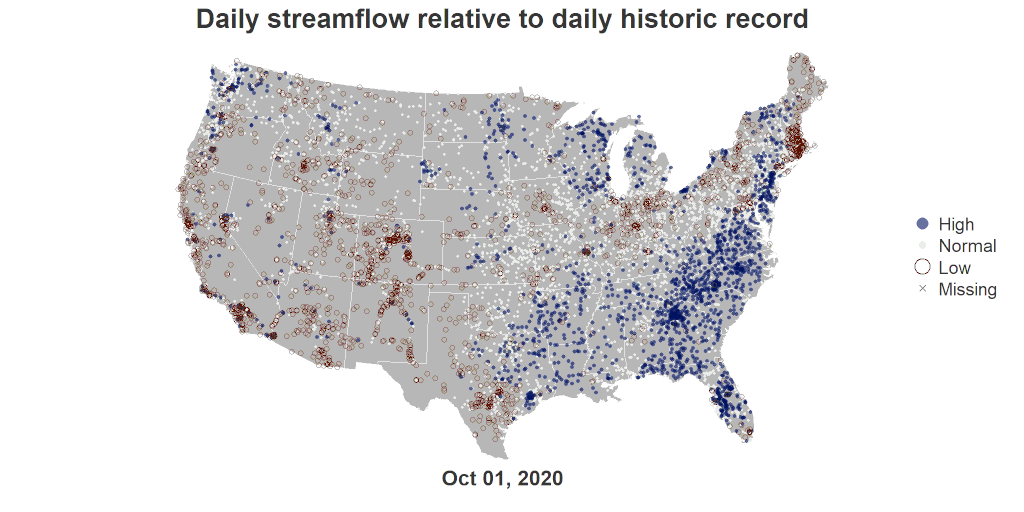
Use R to generate a video and gif similar to the Vizlab animation series, U.S. River Conditions.
Compressed formats, Zarr and Parquet scale much better for retrieving, reading, and storing USGS discharge time series data.
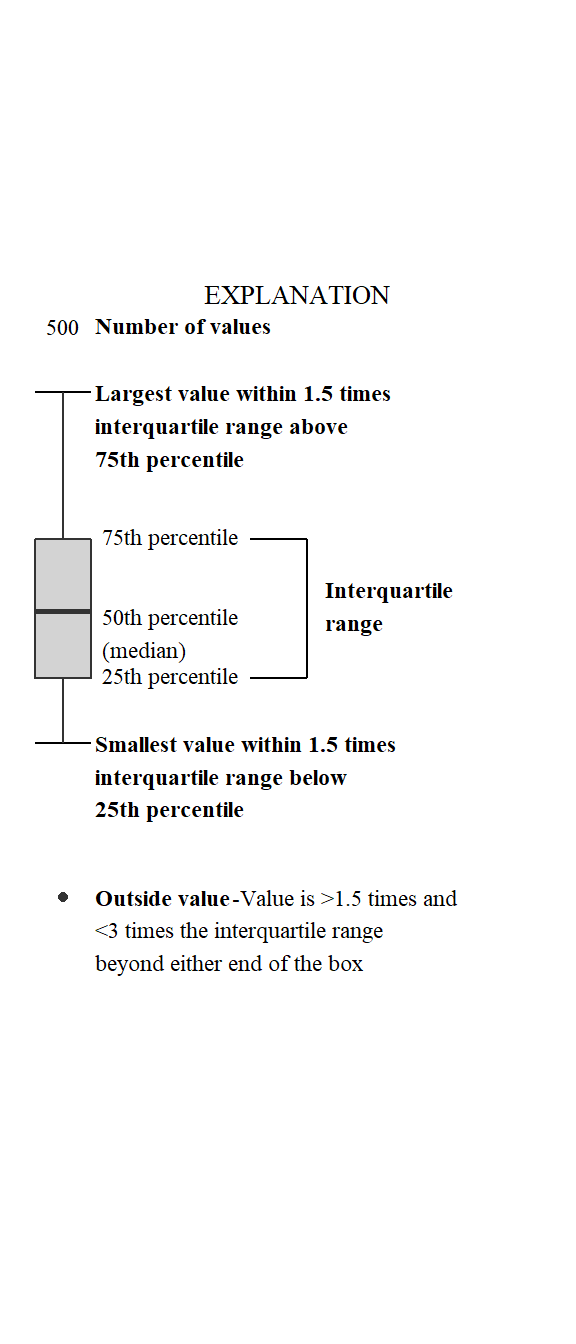
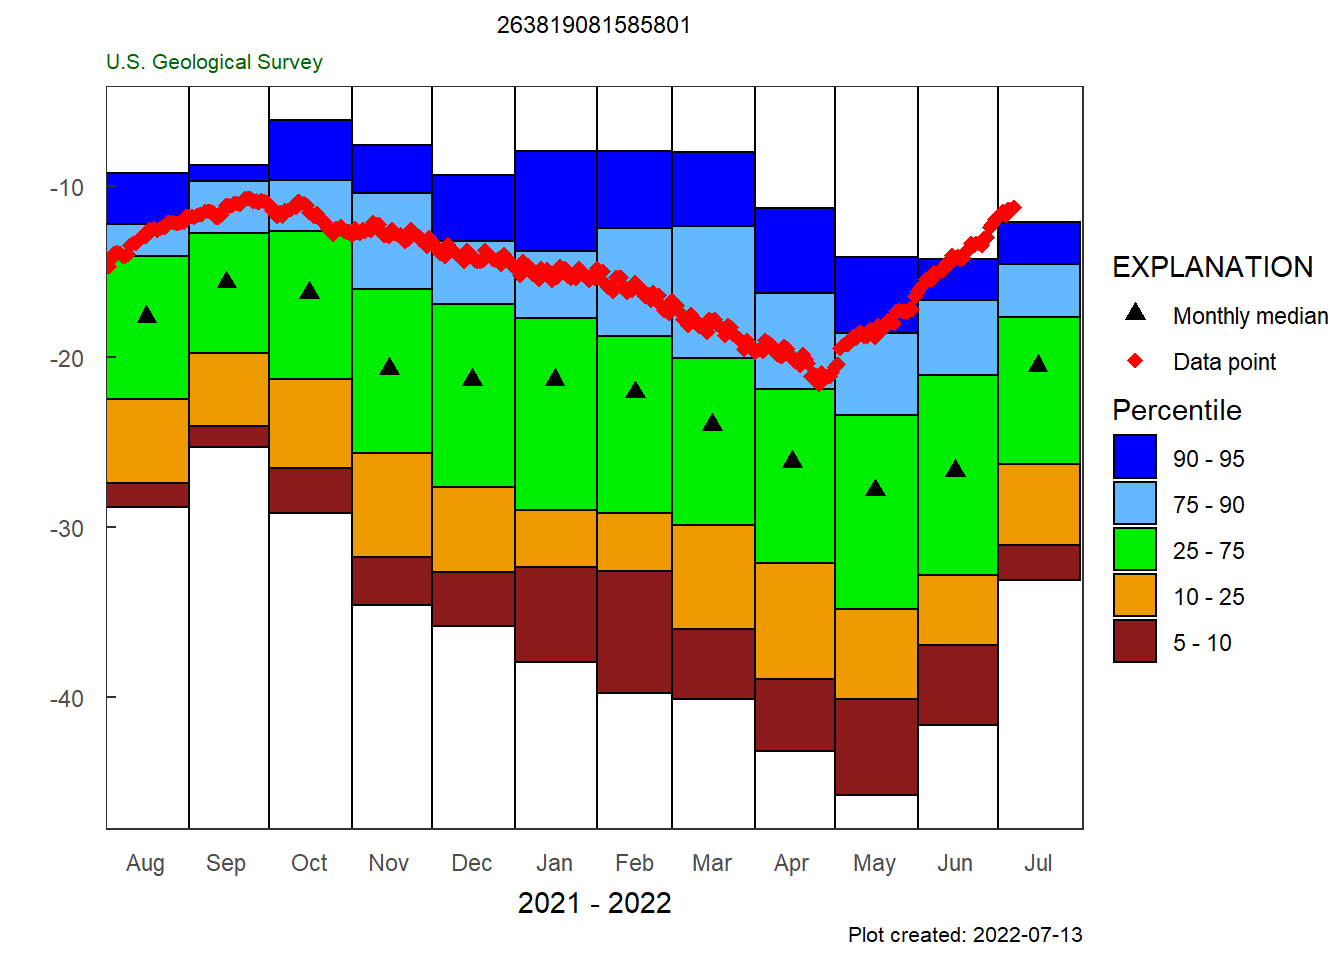
Identifying boxplot limits and styles in ggplot2.

Resources for plotting, plus short examples for using ggplot2 for common use-cases and adding USGS style.