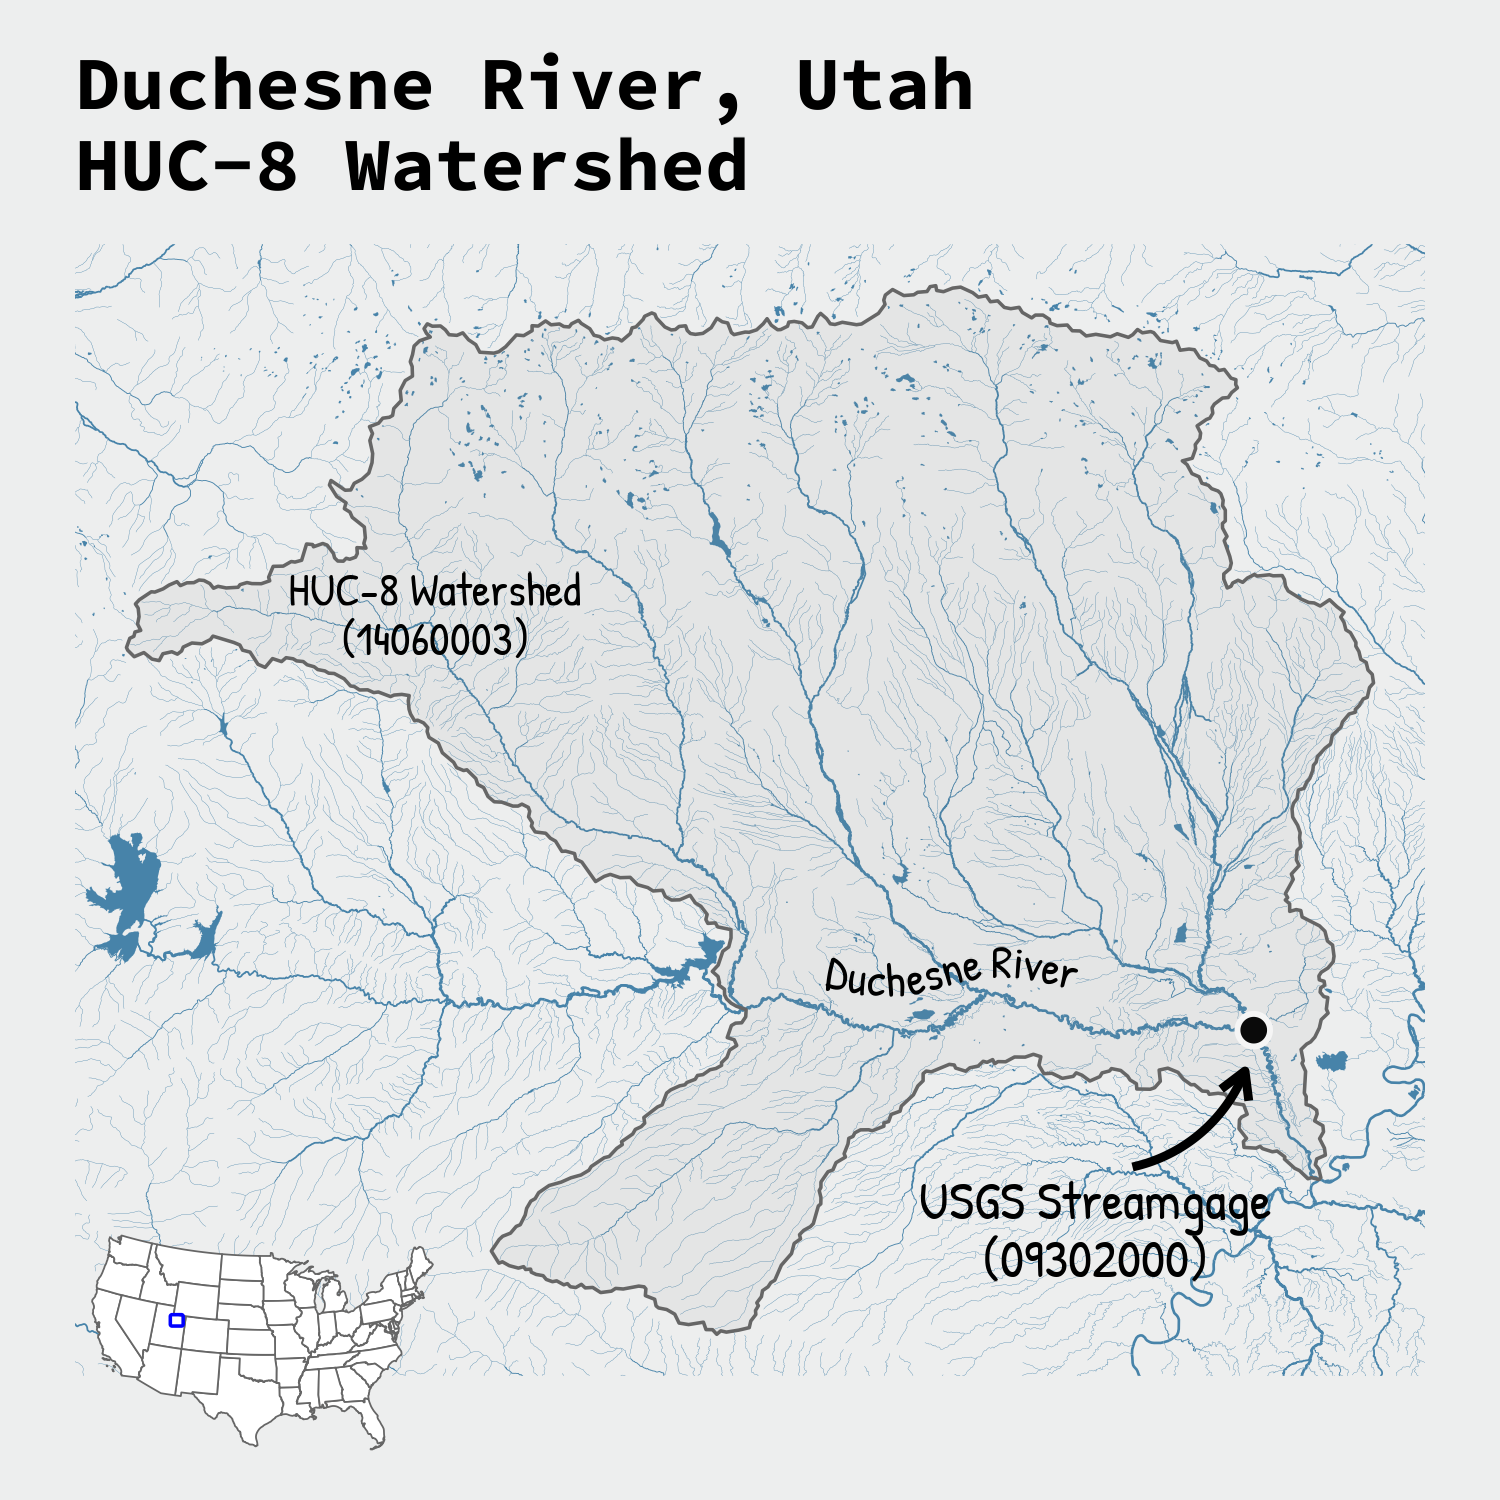
Plotting hydrography data has never been easier with the latest versions of nhdplusTools and ggplot2. This blog demonstrates how to fetch and map National Hydrography Dataset (NHD) rivers and waterbodies with several reproducible examples.

Plotting hydrography data has never been easier with the latest versions of nhdplusTools and ggplot2. This blog demonstrates how to fetch and map National Hydrography Dataset (NHD) rivers and waterbodies with several reproducible examples.

This is a basic dataRetrieval tutorial for USGS water data in R in which we highlight new functionality for dataRetrieval and the new Water Data APIs.
Add assertion tests to your functions to ensure assumptions are met and errors are helpful.

This blog shows several different ways to visualize data from the tidycensus package for R.

Quarto provides easier-than-ever ways to create data-driven, reproducible documents. This blog demonstrates how to use custom code templates to easily replicate code chunks with a reproducible USGS streamgage example!
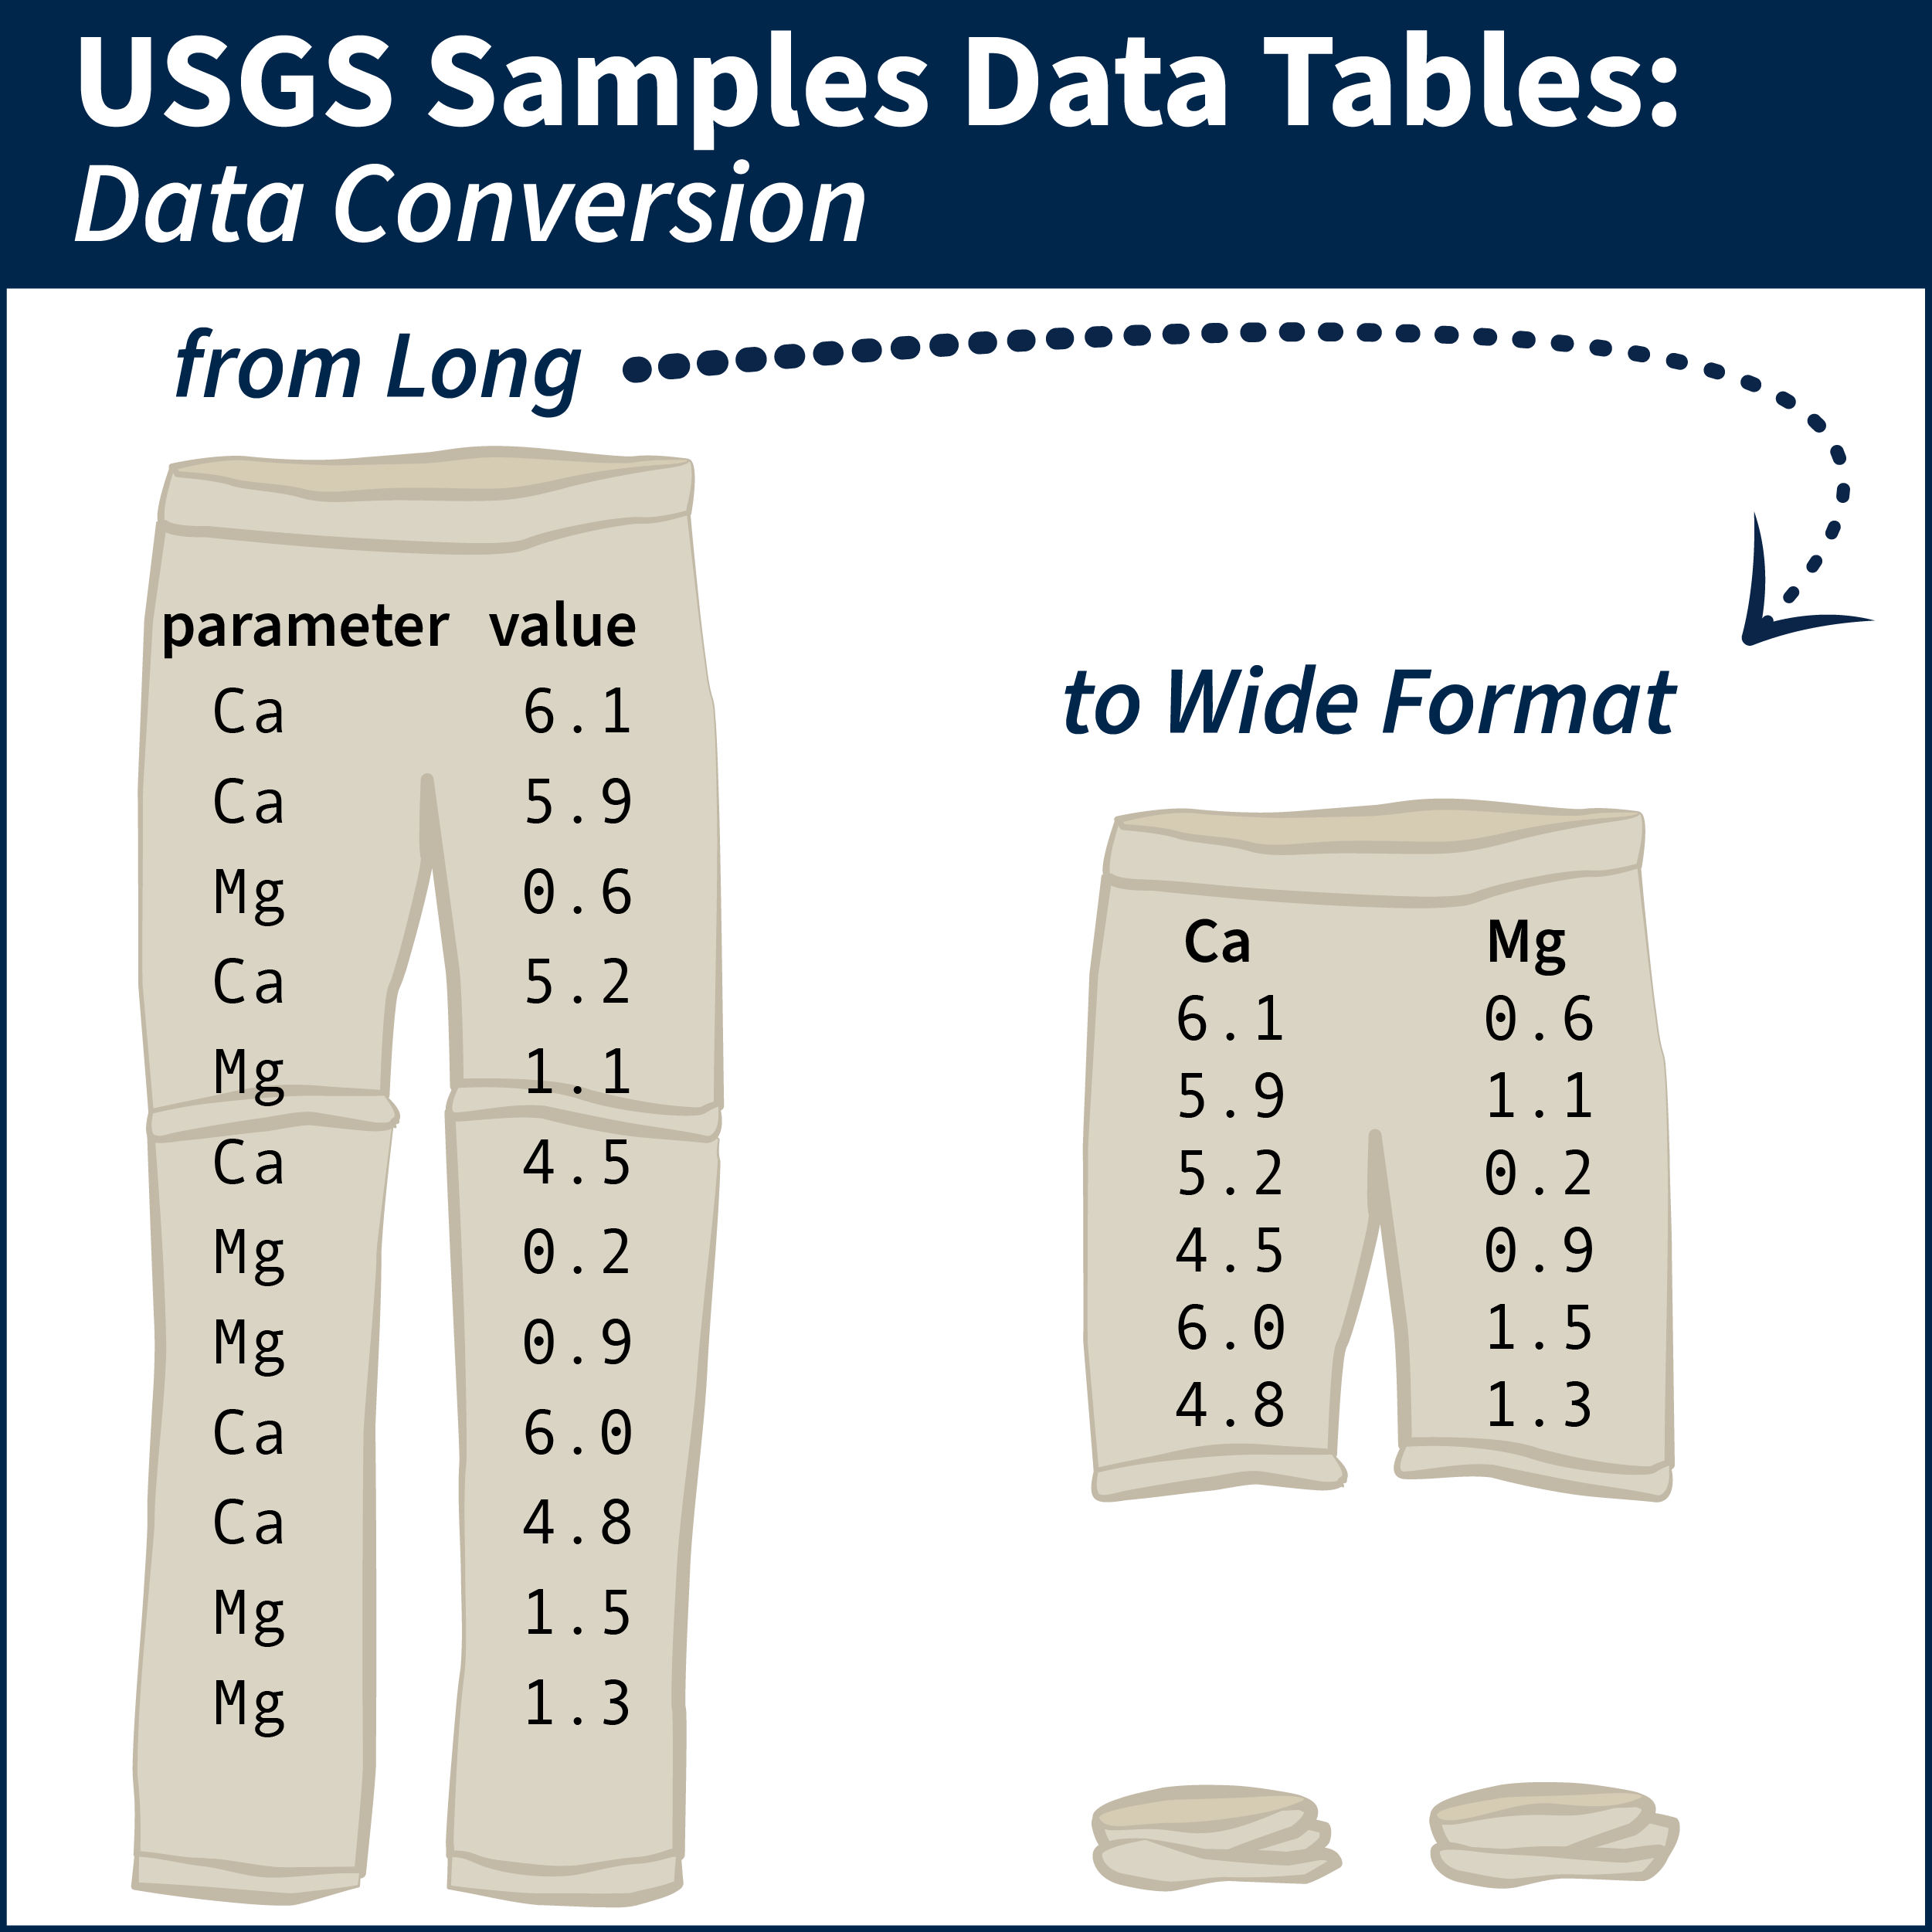
Tips and example R scripts for converting long-formatted data into wide tabular format
Improve your functions with helpful dataframe evaluation patterns.
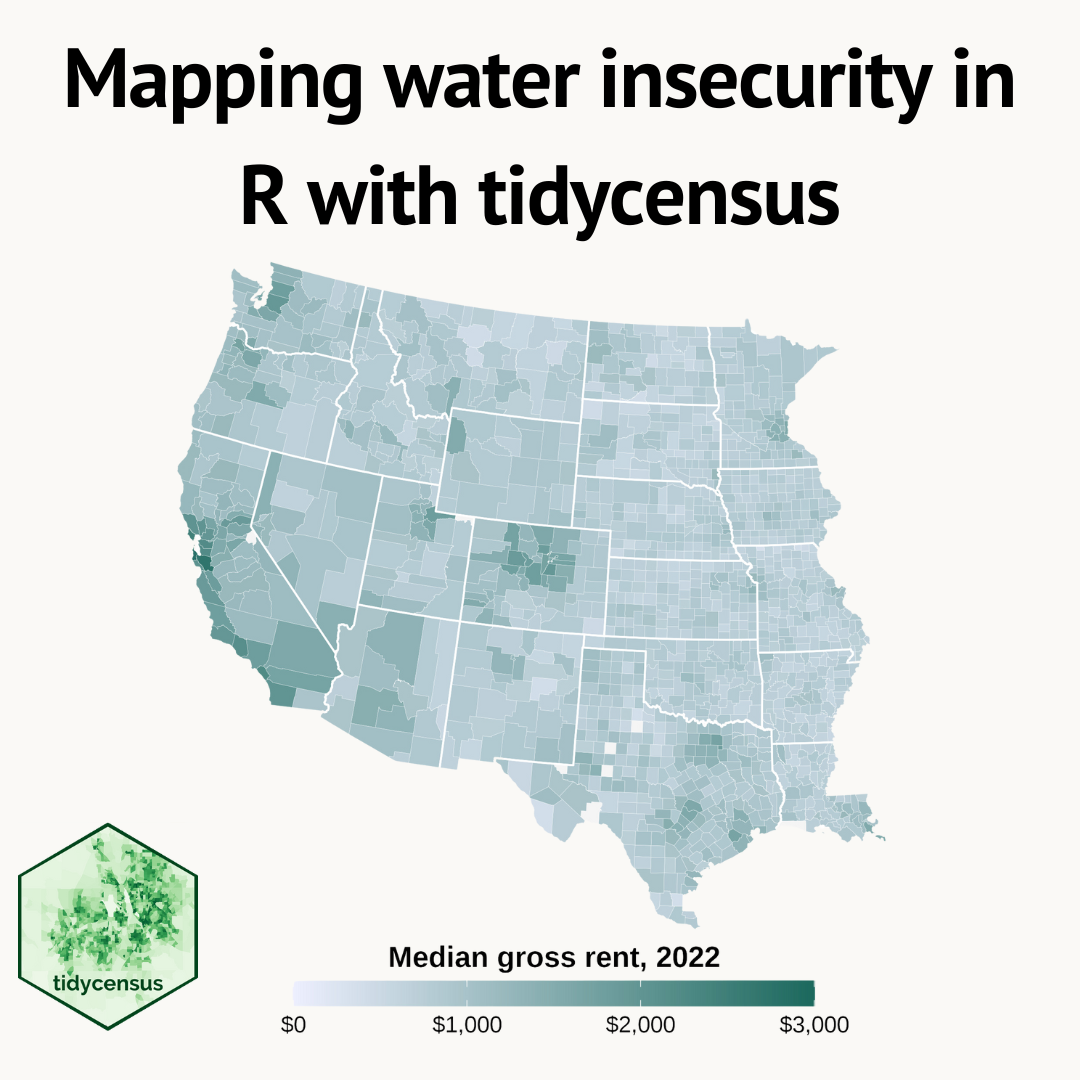
Using the tidycensus package to access and visualize American Community Survey (ACS) data.
Iterate your R code using the map() function from the purrr package.
Write functions in R that run better and are easier to understand.