
Tag: Vizlab
Use R to generate a video and gif similar to the Vizlab animation series, U.S. River Conditions.
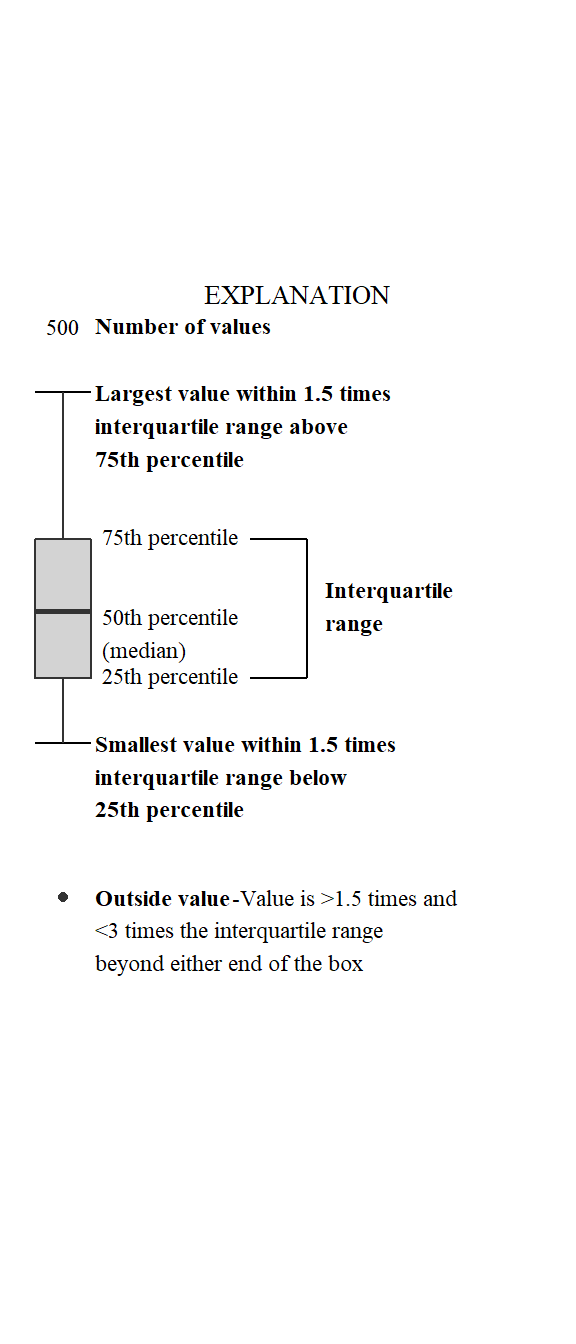
Identifying boxplot limits and styles in ggplot2.

Resources for plotting, plus short examples for using ggplot2 for common use-cases and adding USGS style.