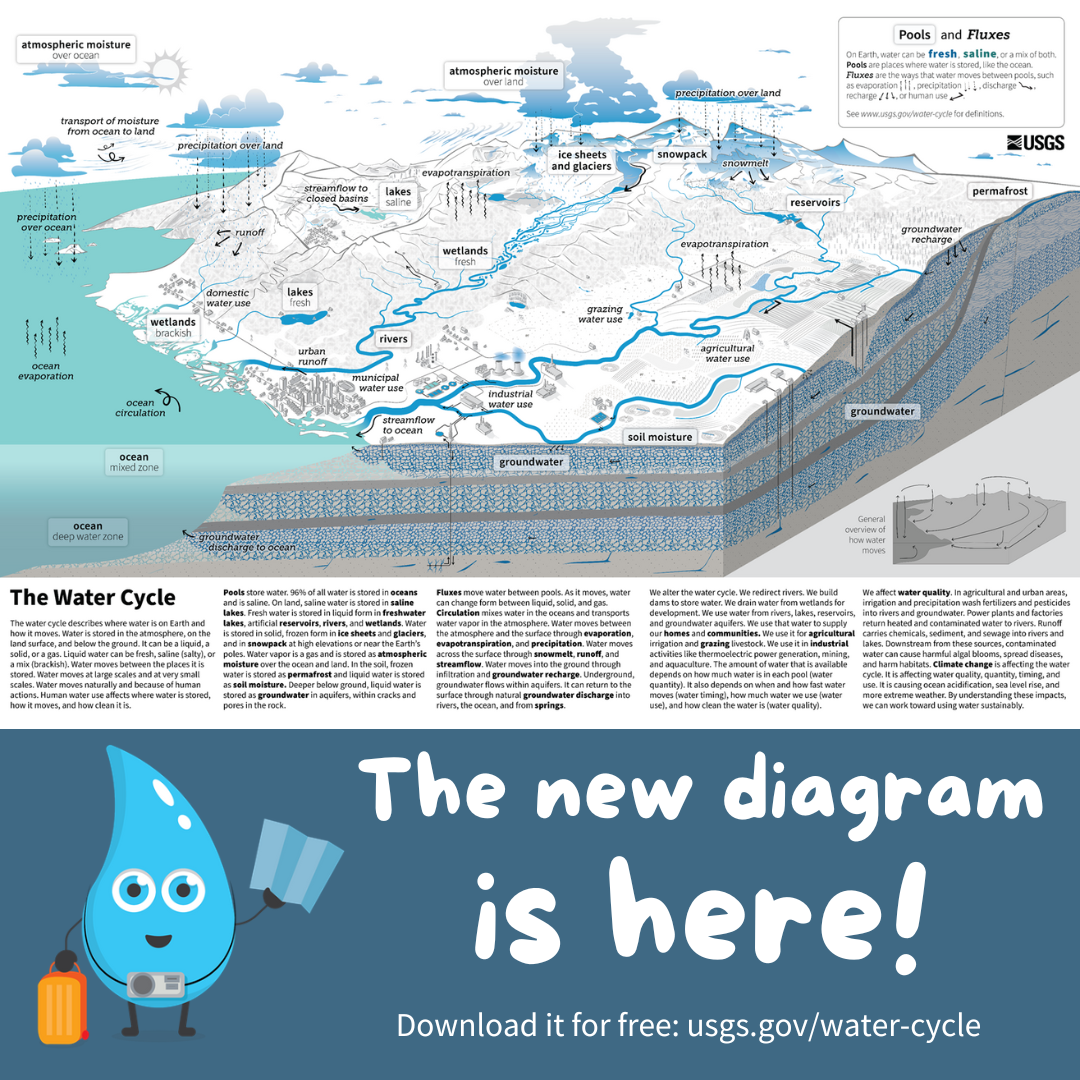
On October 13th 2022, we released a new water cycle diagram! This update re-envisions the water cycle, placing human activities at the forefront. We designed it to emphasize scientific accuracy, information design, and usability in educational settings. We hope that students of all ages better understand how humans affect where water is on Earth and how it moves, so that we can work towards using water more sustainably.