

We’ve made changes to the Monitoring Location Page (MLP) to make all kinds of water data accessible from the same place in WDFN.
Official websites use .gov
A .gov website belongs to an official government organization in the
United States.
Secure .gov websites use HTTPS
A lock (
) or https:// means you’ve safely connected to the .gov website. Share
sensitive information only on official, secure websites.
We’ve made changes to the Monitoring Location Page (MLP) to make all kinds of water data accessible from the same place in WDFN.
Improve your functions with helpful dataframe evaluation patterns.
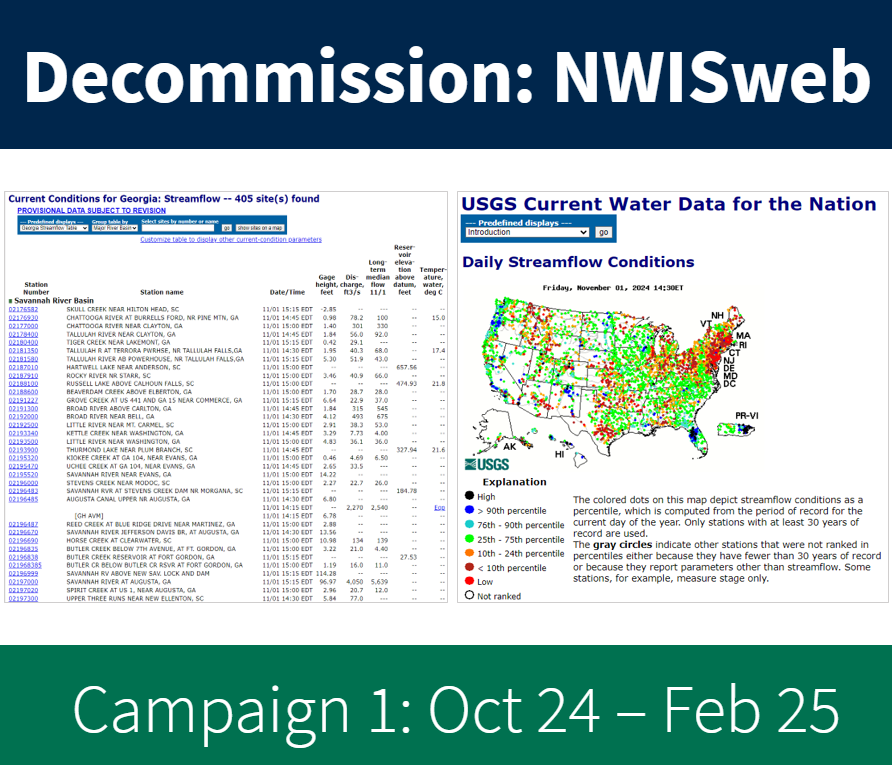
Details of NWISWeb Decommission Campaign 1 from October 2024 to February 2025
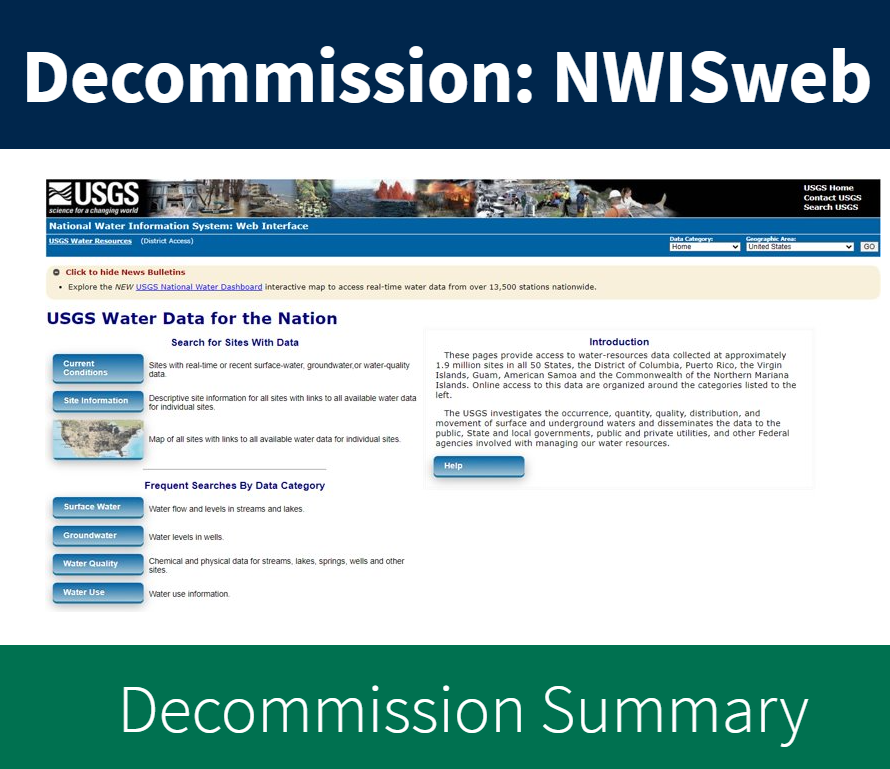
Summary of the NWISWeb webpage decommissions ongoing from October 2024 through February 2027
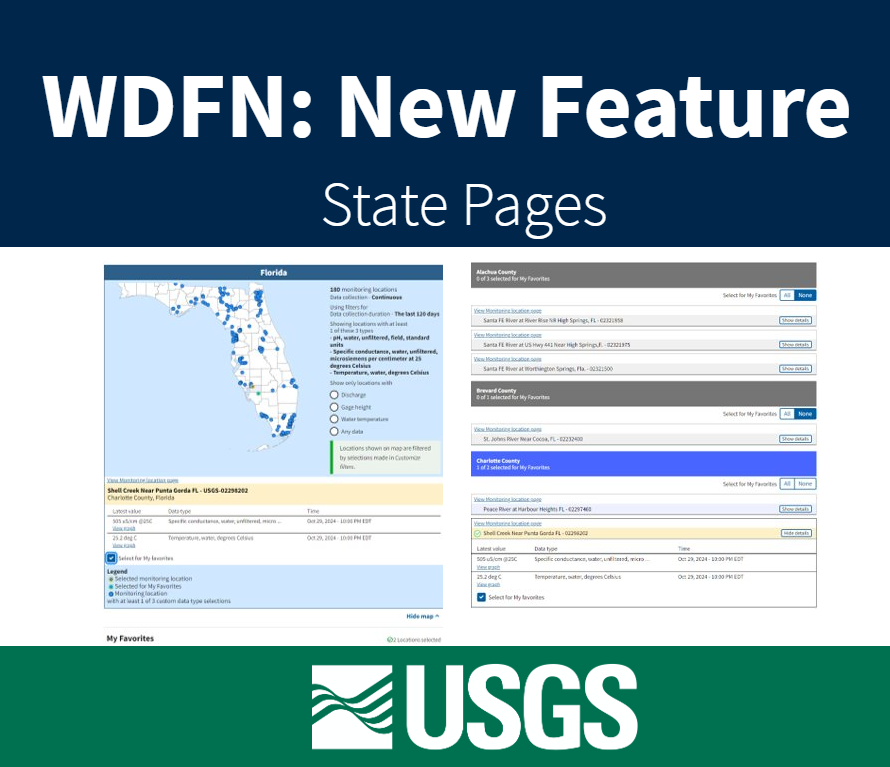
Feature to see current water conditions from all monitoring locations in a state that collect continuous data.
Iterate your R code using the map() function from the purrr package.
Write functions in R that run better and are easier to understand.
Learn the ropes building your own functions in R using water data examples.
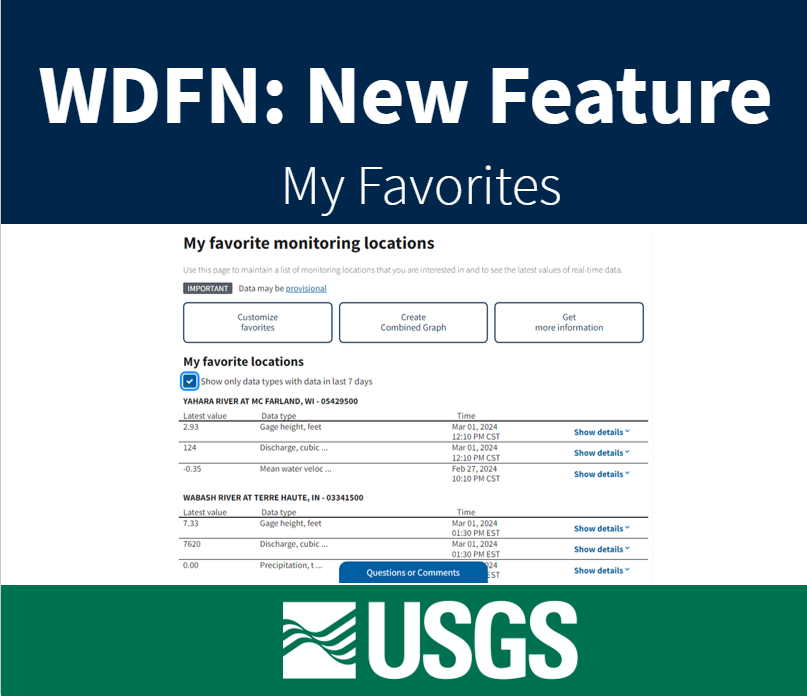
Feature to maintain a list of monitoring locations you are interested in and to see the latest values of real-time data.
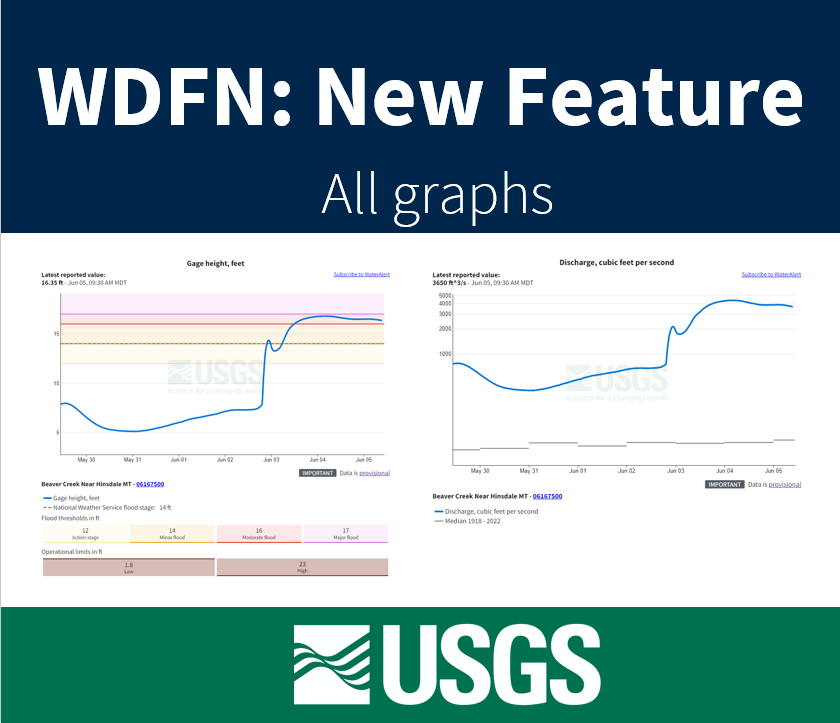
Feature to see a series of graphs of all current sensor data collected at a single location is available now.