
User-Centered Design
Have you ever heard of user-centered design? We put our users first in how we design, update, and implement our water data delivery products.
The USGS Water Resources Mission Area (WMA) is the largest provider of real time and historical water information in the world. A major part of our work on information delivery is to build modern web applications and APIs to make these data publicly available.
We use user-centered design to drive our product and feature development for all our product lines, including Water Data for the Nation (WDFN), Water Science School , and Water Quality Portal .
This post explains what user-centered design is and how USGS Water incorporates it into our work.
What is user-centered design?
User-centered design is a process where we focus our designs based on the context and the needs of our users. We involve users throughout our agile development process.
First, we discover who our users are and how they might use or have already been using our products, allowing us to better identify our users’ needs. There is a lot of helpful information that we can distill from conversations with our users!
Once we understand user needs, we create solutions that can support our users, improving their experience with our products. We then ask users to test our early designs to make sure they are meeting their needs. We incorporate that feedback into our next design iteration. The work is never done!
Ultimately, when applying the user-centered design process, it is very important to remember that we are putting our users at the center of our activities to improve their experience with our products.
User-centered design is not scientific research
User-centered design methods differ from traditional scientific research. The methods rely on qualitative findings, which focuses on insights gained from deep observations, and not numbers. With just a small number of users we can still gain insights about what works or fails in our products, to help move forward with design. A general rule of thumb for usability testing is that testing with five users is adequate to identify the majority of usability issues. With other methods, such as user interviews, we might have a slightly larger sample size, but we quickly see diminishing returns (and common patterns emerging) after just a handful of users. Our goal is to have working data delivery software, which relies on proof-of-use rather than proof-by-analysis to ensure that software is meeting user needs.
User-centered design is an iterative process
User-centered design process is iterative, which means that we modify our products as we better understand our users, and as our users’ needs change. We don’t just work with our users once or at only one point of the design. We are constantly involving our users throughout the entire process, so that we can modify and grow our solutions with our users. This includes exploring and validating design solutions with them.
User-centered design is all about the user experience!
In user-centered design we focus on the entire user experience. This means we think not only about a product’s utility (if it provides the features a user needs) and its usability (how pleasant and easy those features are to use) but on its overall user experience (how users feel when they interact with us and our products).
We strive to create products that meet our user needs by involving them throughout our design process. We also want to be transparent about how we work , provide engagement opportunities, provide timely responses to user questions and feedback through the WDFN Feedback Form , and engage with users in numerous user-centered design methods throughout the year.
Let’s discuss some of the ways we engage with our users through user-centered design methods.
User-centered design methods
There are many methods we can use to help understand our users. Some of our favorites are:
Persona: Personas are representations of our product’s key user segments. Each persona is a composite profile based on observations from real users of water data, who fit the main user type we are working to describe. We’ve identified our four water data user groups—those who use our APIs to access our data, those who download a wide range of data, those who check a few parameters , and those who desire information-dense “at-a-glance” information . They help us turn the abstract concept of ‘the user’ into a person with thoughts, feelings, and common data access behaviors. This helps us understand who our users are and design better user experiences for them.
User Interviews: Semi-structured interviews allow us to ask questions about a topic of interest to gain a deeper understanding of participants’ attitudes, beliefs, desires, and experiences. They allow us to get feedback on early design concepts and learn about our users’ needs.
For example, we’ve been redesigning the USGS water cycle diagram to update its appearance, include human impacts, and improve its scientific accuracy. The water cycle diagram and supporting content is viewed more than 4 million times on our site per year! It was important as we redesigned the diagram that we understood how educators use the water cycle in their classrooms to make sure the redesigned water cycle continues to meet their needs. We conducted interviews with over 10 educators and received feedback from nearly 100 educators as part of this effort. We can’t wait for you to see the result!
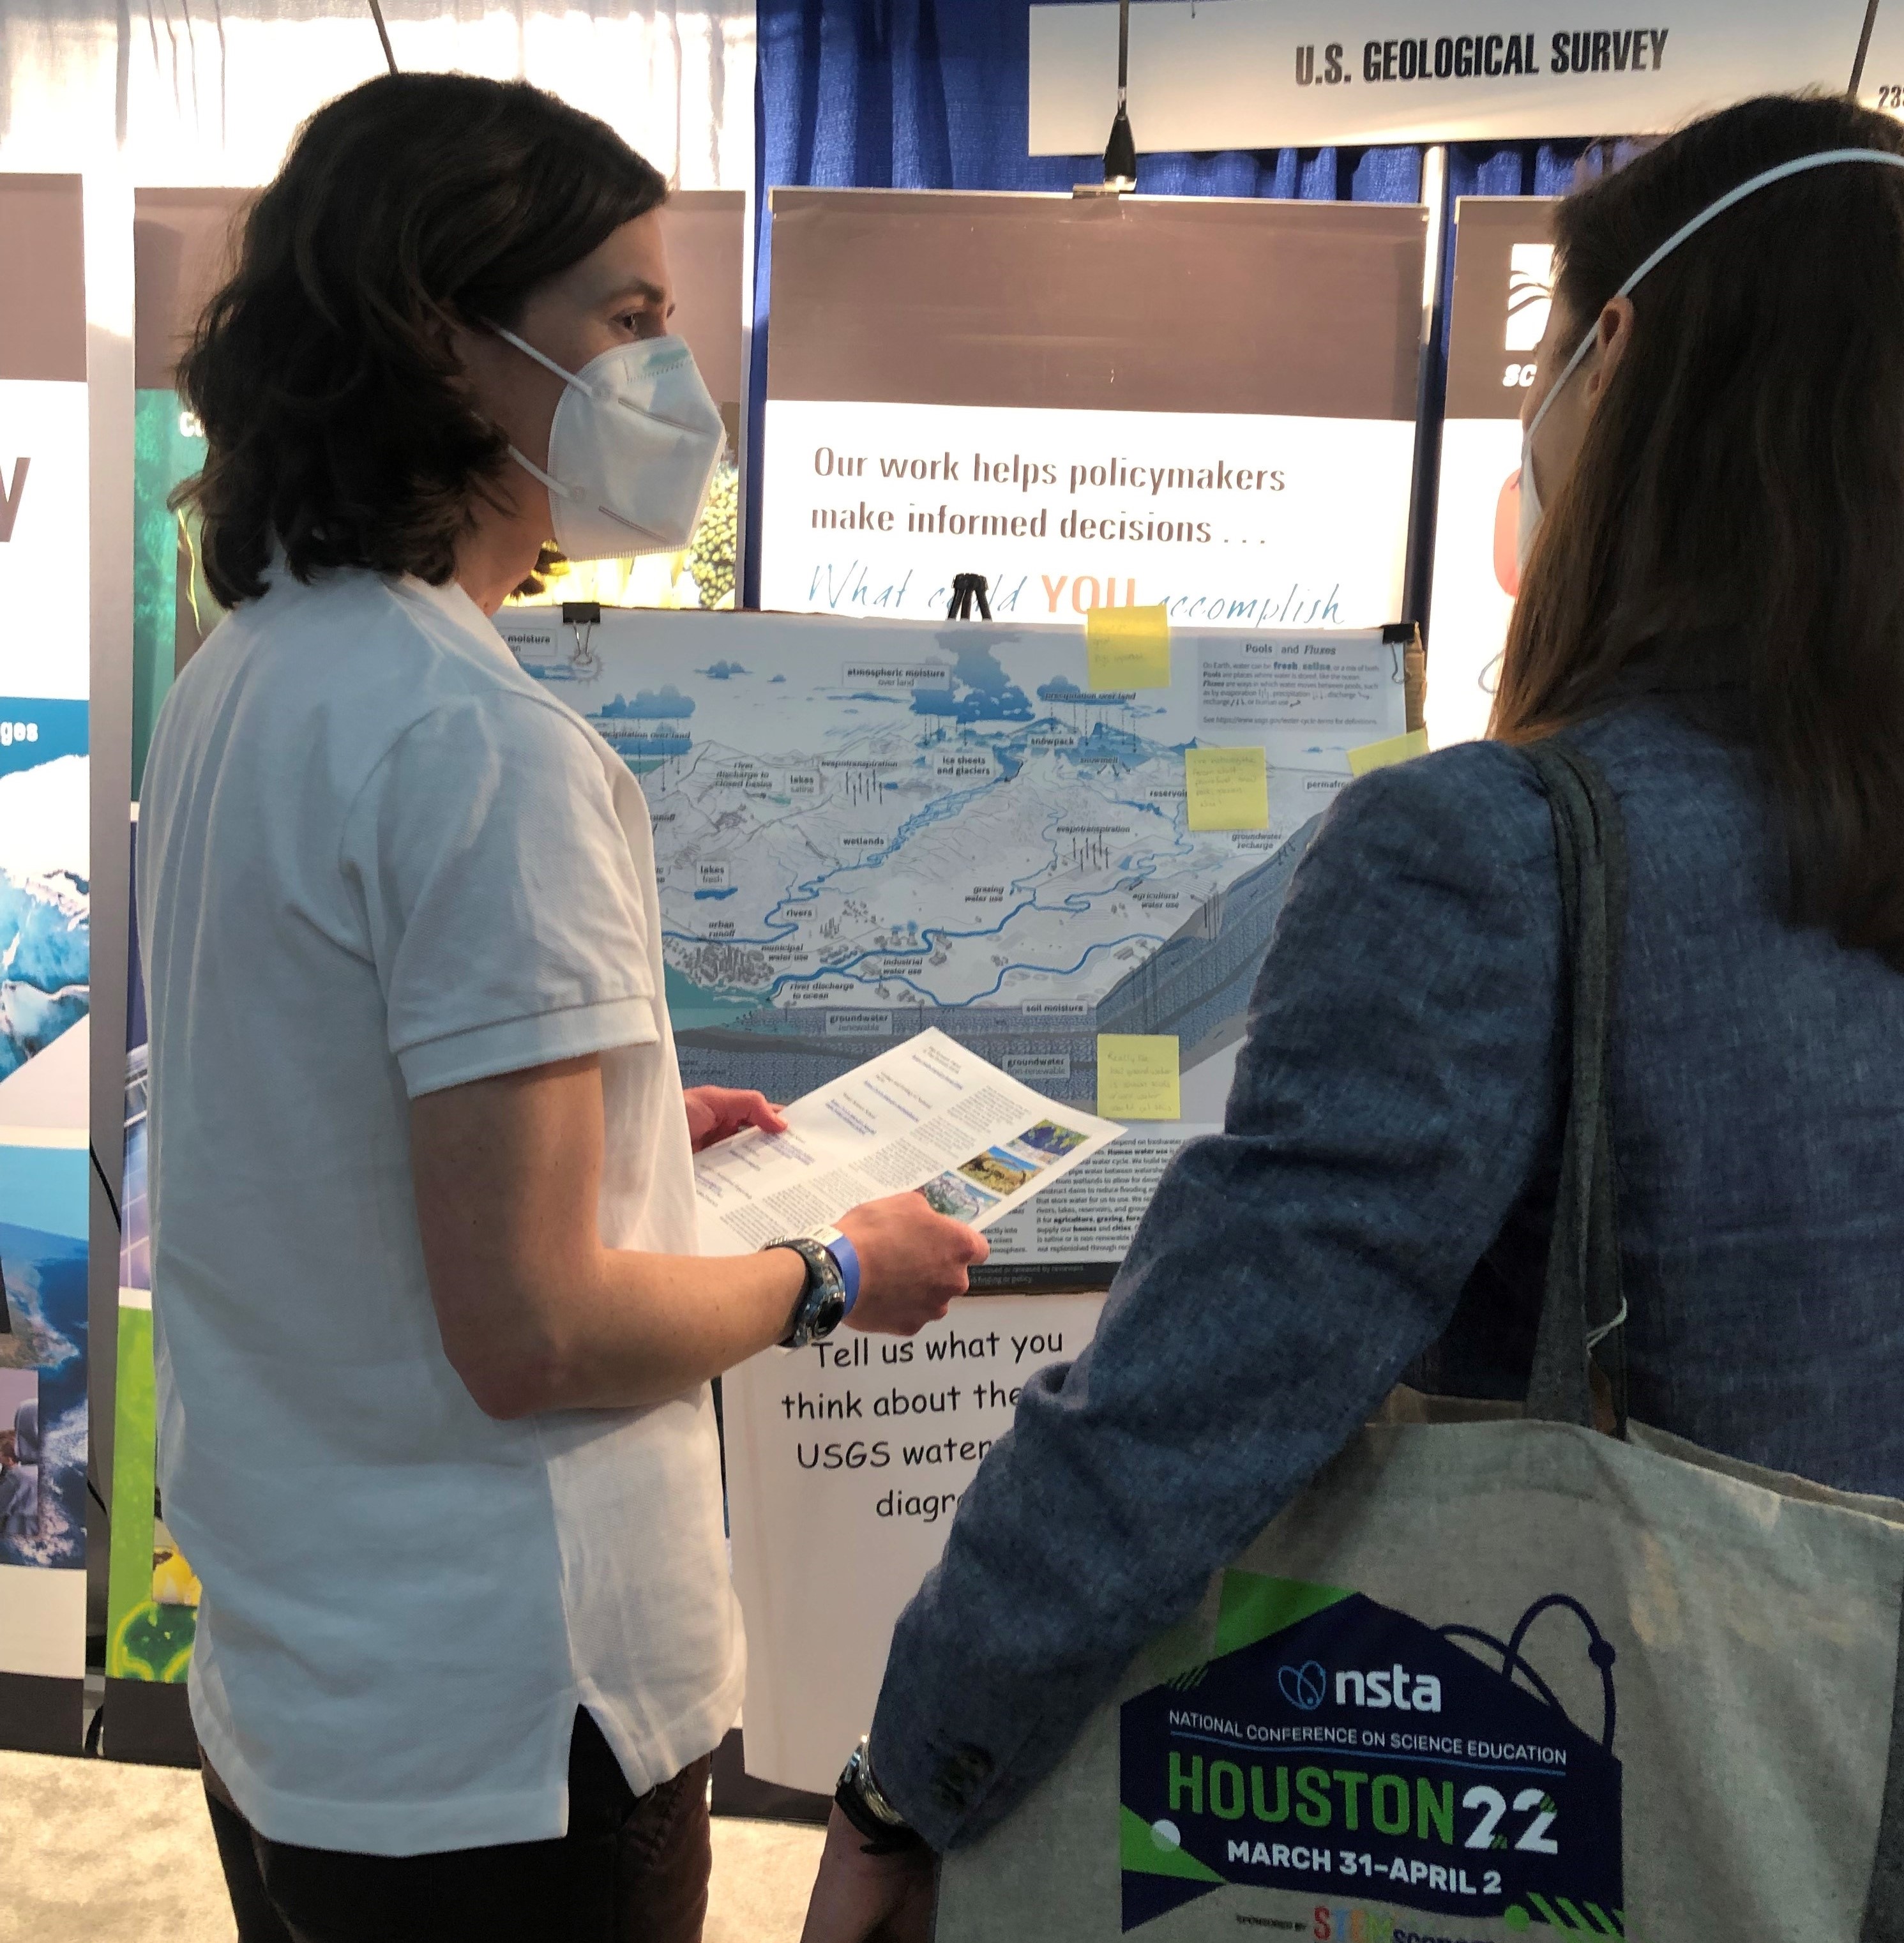
A USGS employee interacting with a water information user. Our team talked to hundreds of educators about the new water cycle diagram at the 2022 National Science Teacher Association Conference in Houston, TX.
User Journey Mapping: Journey mapping visualizes the process that a user goes through in order to accomplish a specific goal. We take a persona and put them in a scenario and map out the phases of their process or the journey. We visualize how the persona completes that scenario, how they feel along the way, and what their touchpoints and pain points are along the process. Journey maps serve to create a shared understanding of a user’s flow and are a great reference as we continue with design.
Over the next several years we will be decommissioning several of our products (Water Watch, Groundwater Watch, and Water Quality Watch). To prepare for this, we needed to learn about the products’ current users so we could make a well-informed plan for modernized replacement technology. We interviewed dozens of users and created journey maps for the four main user types (personas) to illustrate which parts of the ‘Watches’ users need and why they use them. These journey maps help us understand the key elements from the decommissioned products that we need to carry forward with the replacement.
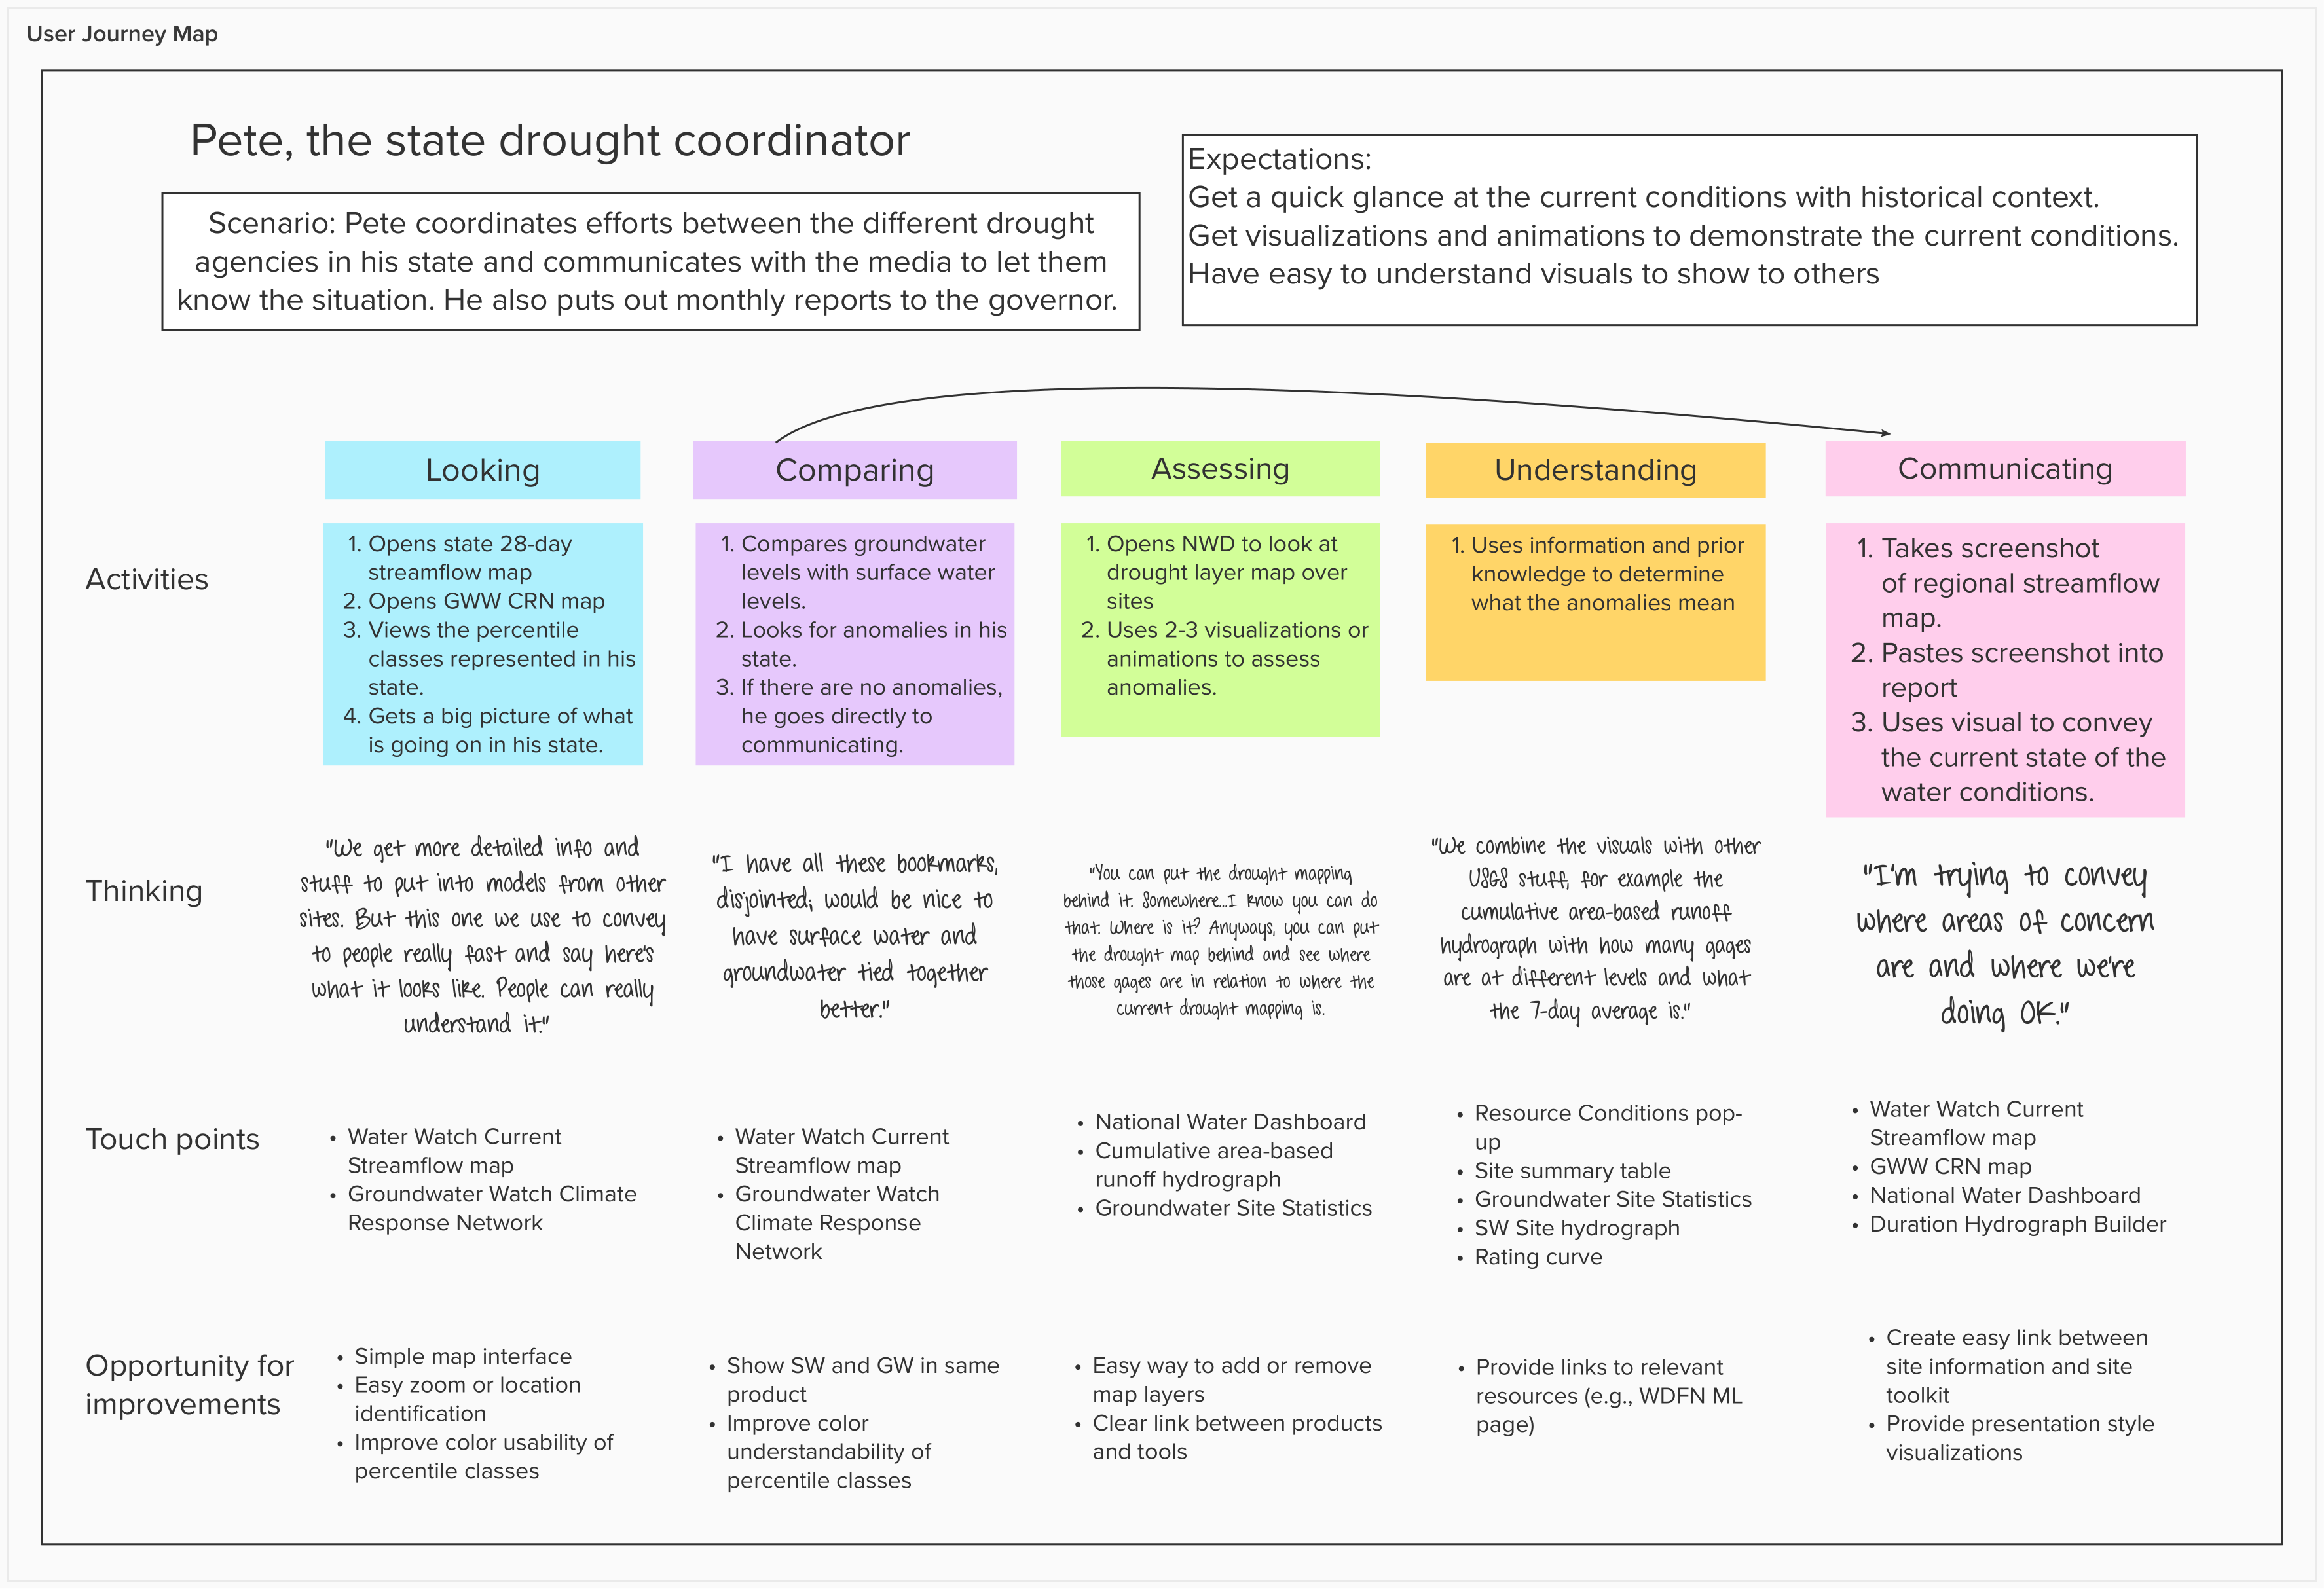
A user journey map for a state water professional who uses Water Watch, Groundwater Watch, and National Water Dashboard to understand their state’s current water conditions with historical context in order to communicate with different government agencies and the media. This user journey helped our team understand how multiple products support one use case and identify ways to improve the data delivery.
Moderated Usability Testing: Moderated usability testing asks users to perform representative tasks on a product while the researcher (or facilitator, moderator) observes their behavior and listens to the users’ feedback. Usability tests can be done at any point in the design, from early static prototypes to live webpages. Designing the appropriate tasks and involving the representative users are two of the key components of a productive usability testing session. We regularly conduct usability tests of our products. We relied on usability testing to redesign the Water Quality Portal , the Monitoring Location Pages , and WaterAlert .
Affinity Mapping: We frequently use affinity mapping to help make sense of our user interview or usability testing findings. It is a way to find themes in collections of ideas, quotes, or observations. The activity involves using a white board or remote white boarding technology and have each team member place sticky notes of quotes, concepts, and ideas from user interviews or usability studies. As a group, we then organize the sticky notes into related groups and draw out important themes from the groups. Affinity mapping helps us talk through our findings, make sense of what we found, and organize our findings in a logical way to inform our path forward.
Additional methods and resources can be found at the digital.gov resource page for usability: https://digital.gov/topics/usability/
How we work
We incorporate our user research and findings into our work and use the artifacts from our user research (e.g., personas, journey mapping) to keep our designs focused on user needs. We conduct user research and usability testing in three ways:
Iterative User Research: We regularly conduct short, iterative usability testing or interviews as we develop our products. Over the course of a few days to a week, we’ll talk to a handful of users (often talking to just five users gives you most of the insights you need!) and incorporate those findings into our development process. We’ll repeat this process throughout a product’s development. Here you can read about some of our planned development for the monitoring location pages based on user feedback: https://waterdata.usgs.gov/blog/nextgen-mlp-update/
Path Analysis: We use a short, intensive discovery process, called a path analysis at the beginning of any major development project. A path analysis helps us understand the problem space and identify a path forward. In a path analysis, we focus on understanding our technical systems and our user needs. We conduct a series of user interviews (up to 50 interviews!) during the 8–10-week path analysis, and we use the user findings to finalize our path forward, including product plans, implementation details, and additional research we still need to continue.
Mini-Path Analysis: Sometimes as we work, we identify a problem we need to quickly correct, but first we need to understand our user needs to help determine the solution. These can happen at any time in our design or development cycles. We assemble a team of researchers to assess the technical challenge and understand the associated user needs. The mini-path analysis has a more limited scope than a full path analysis and we often complete it within 4 weeks. You can read about a mini-path analysis we did about groundwater observations here: https://waterdata.usgs.gov/blog/groundwater-data-update/
Moving forward
As we move forward, we will continue to involve our users as much as possible, especially through usability testing. We strive to focus on asking our user’s thought process, getting their feedback, observing what they do, and keeping them at the forefront of our minds as we develop, design, and create. This will help us in improving how we can provide better solutions for our users.
We employ user-centered design to make high-quality information on Water Data for the Nation and our other products discoverable, accessible, and usable for everyone.
Are you interested in participating in future usability testing and research? If interested, please email us at wdfn_usabilitytesting@usgs.gov and let us know which product(s) you use and how you use it. We’ll add you to our roster!
Categories:
Related Posts
User-Centered Design - WDFN Multi-Location Functionality
August 18, 2025
User-centered design is a process where we focus our designs based on the context and the needs of our users. We involve users throughout our agile and user-centered development process. The core principles of user-centered design are to learn about the users, build for their needs, and refine your designs based on their feedback.
This blog post focuses on how we used the core principles of user-centered design to modernize the Water Data for the Nation (WDFN) multi-location functionality. Learn more about user-centered design in our previous blog.New Feature - Expiration of alerts on WaterAlert
May 20, 2026
Since the modernized version of WaterAlert was launched in 2022 , it has grown to help over 60,000 users stay informed about changing water conditions at their selected monitoring locations. Automatic alerts by email or text inform users when conditions meet threshold values they have set, and in 2025 the WaterAlert system sent over 13.5 million alerts with spikes of over 350,000 per week during critical events and emergencies in the spring and summer.
Modernized access for USGS rating curves is now available
April 28, 2026
Modernized access for USGS rating curves is now available
The USGS publishes rating curves describing the relationship between stage and streamflow at a monitoring location. Historically, these curves have been published at the NWISWeb Ratings Depot, available at https://waterdata.usgs.gov/nwisweb/get_ratings .
Updates and improvements to the National Water Dashboard
March 19, 2026
The National Water Dashboard (NWD) continues to evolve as we modernize our water-data delivery tools and improve how users discover, explore, and interact with real‑time information. Our latest set of updates focuses on simplifying the map experience, improving usability, adding new ways to customize your view, and continuing our long‑term transition away from legacy services. Below is an overview of what’s new.
Highlights from our 2024 WDFN User Survey
February 6, 2025
In October 2024 we asked people to answer a few questions about how they use Water Data for the Nation (WDFN), and over a thousand of you answered. We heard from people around the country, including 47 states, American Samoa, and Puerto Rico. We learned a lot from you and would like to share what we found.