
Highlights from our 2024 WDFN User Survey
In 2024, we asked our users for feedback. This is what we found.
What's on this page
In October 2024 we asked people to answer a few questions about how they use Water Data for the Nation (WDFN), and over a thousand of you answered. We heard from people around the country, including 47 states, American Samoa, and Puerto Rico. We learned a lot from you and would like to share what we found.
To put that month in context, during that period over 950,000 people visited one of our webpages (this includes any page that has the URL waterdata.usgs.gov or waterservices.usgs.gov). That includes:
- 255,224 people visited a legacy NWIS page
- 692,275 people visited a WDFN page
- 8,651 people visited a Water Services web page (Note: many people who use water services do not regularly visit the website because they set up scripts that automatically get data, so this low number is to be expected)
Why do people use WDFN?
People use WDFN all the time! Most people are using WDFN daily or weekly. We also heard from about 100 of you who only use WDFN in an event or storm. A user from Florida said,
“Keep up the great work. You all single handedly keep me safe. My creek is not very big, but it floods horribly forcing me to evacuate in short notice. Your gauges keep me in the know and keep me safe. I’ve relied on you all for years and you’ve never let me down with amazing accuracy. Thank you so much."
Did you know? During the survey period, Hurricane Helene and Hurricane Milton hit the southeast. We have two tools that people find helpful in periods of extreme weather. The National Water Dashboard shows real-time conditions across the United States. Water Alert provides near real-time notifications about gages based on your defined threshold.
People use WDFN for all sorts of reasons from the common things like flooding/personal safety, fishing, and boating/canoeing/kayaking to the uncommon like gold mining and geocaching. We appreciate hearing how people use our data. For instance, this user from Louisiana said,
“As an inshore kayak fisherman, I rely very heavily on the tools you provide, especially salinity and water temperature trendlines. I check the 30 day and 1 year and sometimes look at a ‘custom’ 3-year trend line. It helps tremendously to plan my next fishing trip with some data. Thank you for your work, fisherman appreciate it!”
Hearing from users like this helps us understand how people use the data past the default seven-day display on the Monitoring Location Page hydrograph . Understanding why and how people use our data and pages helps us make important design decisions. For instance, we heard from several people that when they viewed the Monitoring Location Page on their phones, they would get stuck in the hydrograph, and when they tried to scroll past it, it would just adjust the graph settings. Based on the feedback, we reduced the size of the graph on mobile devices to provide more white space around the edges of the screen. We hope this makes it easier to scroll and interact with the page and the graph.
While WDFN serves lots of people who use WDFN for personal activities, we also serve water professionals. People in the federal government, universities, community groups, and state agencies (to name a few!) rely on WDFN for their jobs. Jobs that rely on water data can vary a lot. They include typical water management jobs like operating a reservoir or managing a city’s water supply. Other jobs rely on water data from emergency management, building and managing septic systems and wells, to agriculture.
Some of the water professionals also fund our gages. We refer to them as cooperators. They check the website daily to make sure the gage is operating properly, and they also use the data to conduct research or make decisions.
What data do people use in WDFN?
WDFN serves hundreds of continuous data types and thousands of discrete sample data types. A common misconception is that people only care about CFS/discharge. However, our survey found that more people are looking at gage height than discharge! Over three-quarters of respondents rely on gage height and half of the respondents rely on discharge. While discharge is still an important metric for many people, gage height also provides valuable context.
Water temperature was the next frequently viewed data type. We received over 30 comments requesting USGS puts in more water temperature gages. A user from Indiana said,
“I am very disappointed that the water temperature for the Saint Joseph River in Niles Michigan has been discontinued. This was a vital resource for me, I use the water temperature to know when to make my trips up to trout salmon fish in the spring and fall. I travel over 100 miles to chase these fish, so it is very profitable for me to have access to the water temperature.”
Besides surface water, people also rely on our webpages to provide groundwater information. About 100 of the respondents check for depth to water or groundwater information.
We try to take user needs about data types and stream gages into account, but at times funding considerations make difficult decisions for us. In the case of the Saint Joseph River station , funding was obtained, and water temperature data is still collected. Sending your local Water Science Center a message about how you use a gage and why it’s important is helpful. The questions and comments button on any of our modernized webpages allows you to send a message to the Water Science Center that manages that gage.
What pages do people use in WDFN?
The current conditions hydrograph on the Monitoring Location Page (example ) is used by nearly everyone who completed the survey. Some of the pages released this year were also popular. My Favorites was released in March, and already we can see its use growing. From the My Favorites you can also compare conditions at more than one location on a graph . This is a great tool if you frequently check conditions at the same locations.
People are also using a map to find locations or compare current conditions to past conditions (colored dots on the map). While our old pages like NWISMapper and WaterWatch provided that functionality, our newer pages like the State Page and National Water Dashboard provide similar functionality and will continue to incorporate more of these features
Other people are doing more than just checking our webpages for the information. A smaller group of users are downloading our data for further analysis, using R or Python to access or data, or using an API to programmatically access our data. While we’ve done a lot of work to modernize our webpages, these tools will also soon receive a facelift.
Are people satisfied with WDFN?
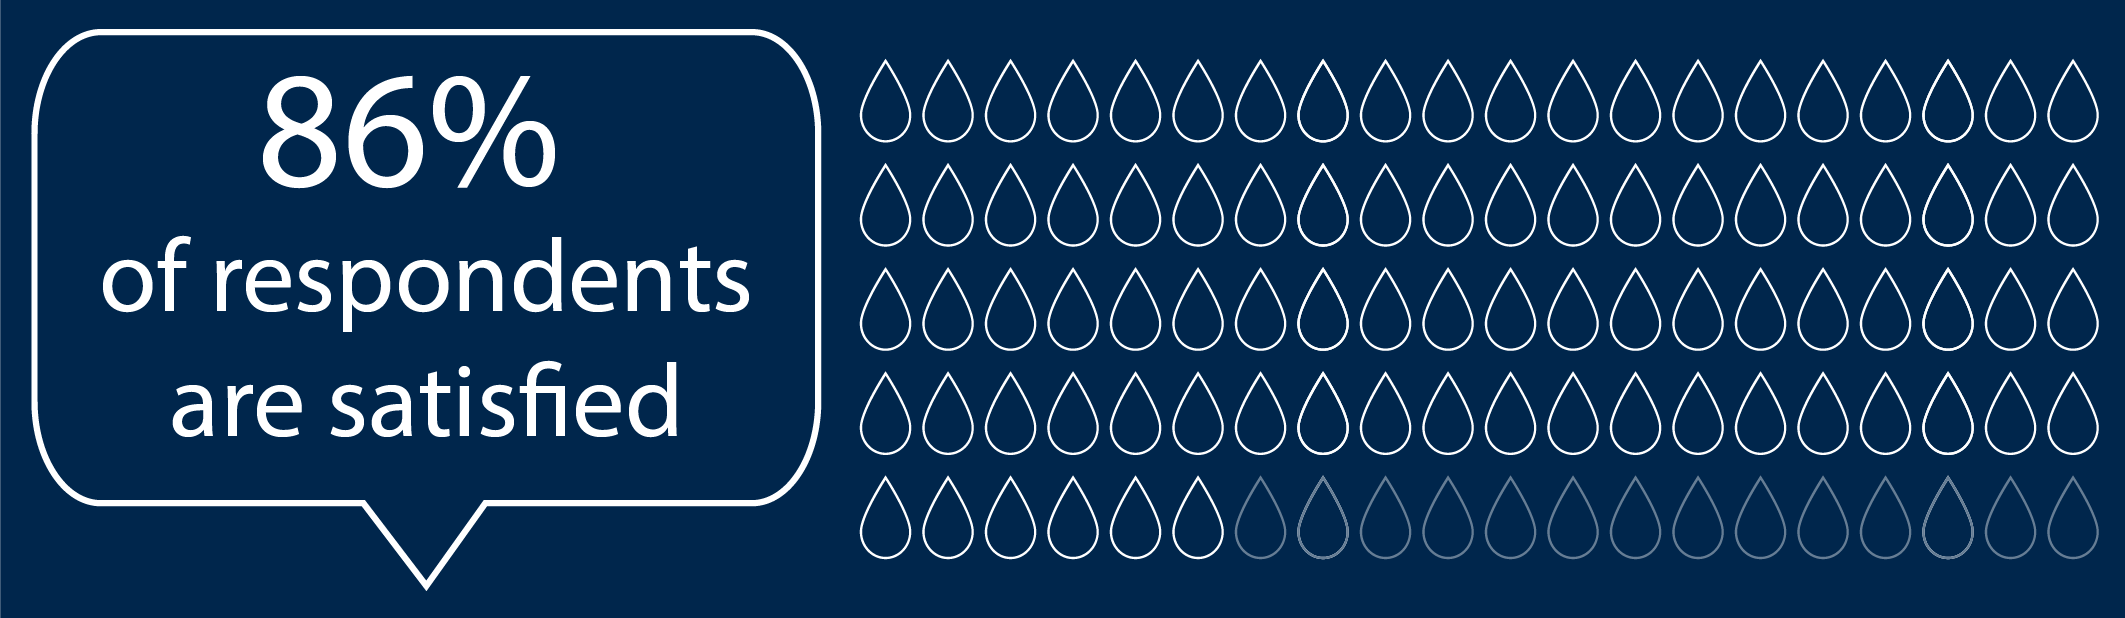
Most people said they are satisfied with WDFN, and only 14% are not satisfied. We strive to improve user satisfaction. We use user-centered design to make our design considerations. We ask people to walk us through how they use the current webpages, test new pages before they are released, and continue to test pages as new features are added. If you’d like to participate in the user-centered design process, please email us at wdfn_usabilitytesting@usgs.gov .
We respond and reflect on every feedback email we receive, and we are constantly trying to improve our website and its navigation. That being said, it’s hard to meet the needs of all our diverse users, especially with all the changes that are happening right now.
Technical considerations and aging architecture have made the decommission of the legacy pages imperative. Thank you for sticking with us as we shake out the bugs on the pages and continue to build out new pages to meet the functionality of the legacy webpages. A few of you asked about specific features—like the ratings depot, better download capabilities, and field measurements. Yes, all of those capabilities will be added to modernized webpages. To read more about the decommission plans, check out this blog: NWISWeb Decommission Campaign Summary | Water Data For The Nation Blog
What do we do with all this information?
As part of our user-centered design process, we build user stories and design for them based on some of the feedback we receive. We also use feedback to identify bugs and issues.
We pass feedback along to Water Science Centers. Water Science Centers manage the water data collection and funding. Some of the gages mentioned already received continued funding since the time of the survey. For example, we received a handful of comments about Meramec River near Steelville, MO . People requested, “Please don’t drop the collection site at Sullivan MO on the Meremec. That is used by a lot of people and we rely on it." In cases where a gage is specifically mentioned, we passed the feedback along to the local Water Science Center. In the case of the Meramec River gage, funding was secured to continue data collection.
We use the feedback to maintain support and funding in USGS Water Mission Area to continue development and improvement of the modernized WDFN pages to replace the legacy pages and infrastructure.
Your feedback matters! While the survey is closed, we listen and respond to all user feedback we receive. Have something you want to tell us? Email us at wdfn@usgs.gov .
Categories:
Related Posts
User-Centered Design - WDFN Multi-Location Functionality
August 18, 2025
User-centered design is a process where we focus our designs based on the context and the needs of our users. We involve users throughout our agile and user-centered development process. The core principles of user-centered design are to learn about the users, build for their needs, and refine your designs based on their feedback.
This blog post focuses on how we used the core principles of user-centered design to modernize the Water Data for the Nation (WDFN) multi-location functionality. Learn more about user-centered design in our previous blog.Advanced Check Status Users
May 19, 2024
Here at WDFN, we employ user-centered design to build better products and reduce risk. This blog is one of a five-part series on users of WDFN: Are You a USGS Water Data User? | Water Data For The Nation Blog .
User-Centered Design
June 8, 2022
The USGS Water Resources Mission Area (WMA) is the largest provider of real time and historical water information in the world. A major part of our work on information delivery is to build modern web applications and APIs to make these data publicly available.
Check Status Users
December 29, 2021
Here at WDFN, we employ user-centered design to build better products and reduce risk. This blog is one of a five-part series on users of WDFN: Are You a USGS Water Data User? | Water Data For The Nation Blog .
Explore & Download Users
December 29, 2021
Here at WDFN, we employ user-centered design to build better products and reduce risk. This blog is one of a five-part series on users of WDFN: Are You a USGS Water Data User? | Water Data For The Nation Blog .