
Daily data in Water Data for the Nation
Where to find and download daily data in Water Data for the Nation
What's on this page
There have been a lot of changes to how you access USGS water data as we work to modernize data delivery in WDFN and decommission NWISWeb. As we centralize and re-organize data delivery in WDFN, we have recently set out to describe different types of water data according to data collection categories . We started with re-organizing and expanding the data collection categories that are delivered on the Monitoring Location Page and are now working to deliver additional data collection categories on other WDFN pages as well. This blog is part of a series to help orient you to where you can find different types of data in WDFN pages and services. In this post, we want to focus on how you can access daily data in WDFN.
Daily data in WDFN
Daily data provide one data value to represent water conditions for the day. Throughout much of the history of the USGS, the primary water data available were daily data. These data were originally collected manually at the monitoring location each day, then transitioned to being recorded at the location. With improved availability of computer storage and automated transmission of data, the daily data published today are generally a summary statistic or single metric of the continuous data collected each day. Daily data are automatically calculated from the continuous data of the same parameter code and are described by parameter name and parameter code (pcode) and a statistic code . These data have also been referred to as “daily values” or “DV”.
We’re still delivering the same data, but how you access and look at it is going to be a little different. In NWISWeb, daily data were delivered on specific /dv webpages, separate from other USGS water data. Now, daily data are delivered in a similar manner to and on the same pages as other data collection categories on WDFN pages. The service delivering the daily data has also changed, from the /dv service in USGS Water Service to a modernized /daily endpoint in USGS Water Data APIs. Read more about where to find daily data on graphs, in a table, via a download, or through our APIs below.
Where can I graph daily data?
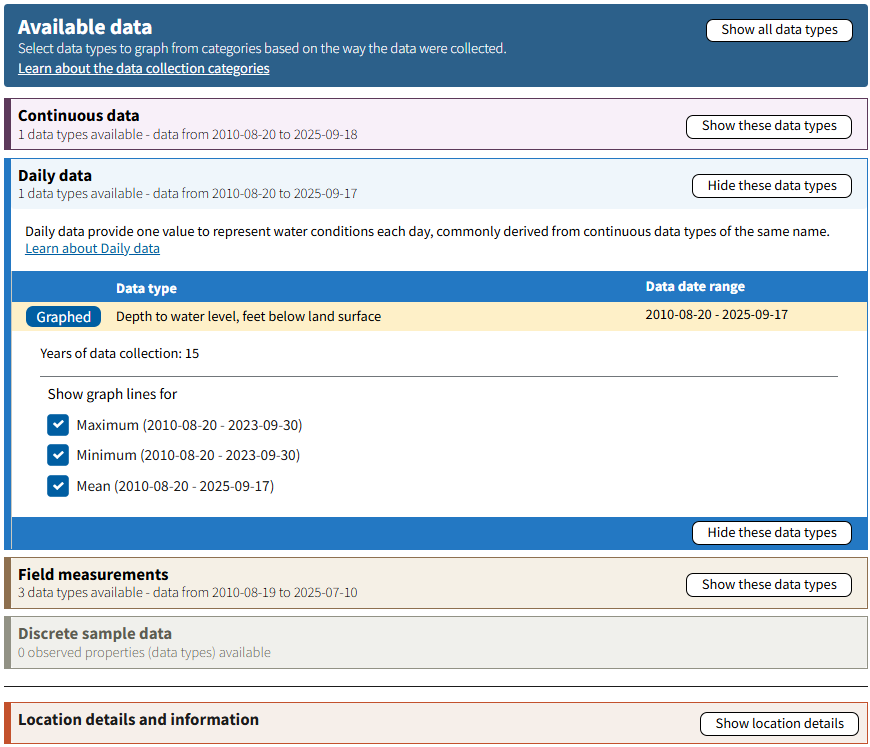
The primary place to graph daily data is on the Monitoring Location Pages, or MLP, which serve as the hub for all USGS water data collected at a location. In the “Available data” section of an MLP, you will see all the available data types at the location, organized into the data collection categories. You can plot daily data by clicking the “Graph it” button next to a daily data type. The image below on the left shows the available data accordions available on the MLP, with an example from monitoring location USGS-354133082042203 .
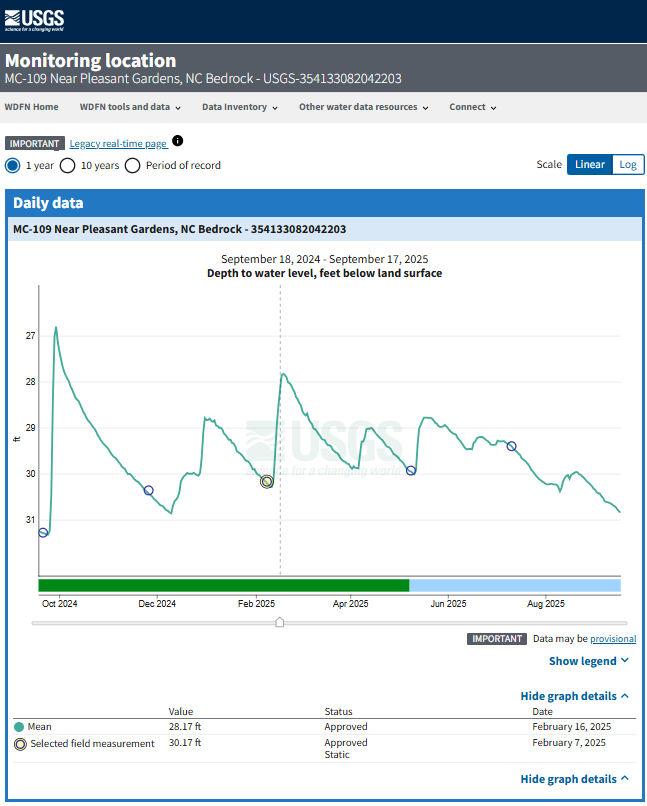
All available statistic codes for your selected daily data type will be shown on the graph, and you can turn them on and off with the check boxes. The daily data graphs default to display a time span of 1 year. You can use the radio buttons above the graph to quickly switch to 10 years or the full period of record at your location, or change to a custom time span within the “Change time span” action button below the graph. If your selected daily data type is discharge, gage height, or groundwater level, the associated field measurements will be shown on the graph. The image below on the right shows the daily data graph for monitoring location USGS-354133082042203
Reminder!
The URLs for the MLP can keep track of the choices for data type and time period you’ve made on the page, so be sure to bookmark the page after you’ve set it up the way you like to return to the same view.
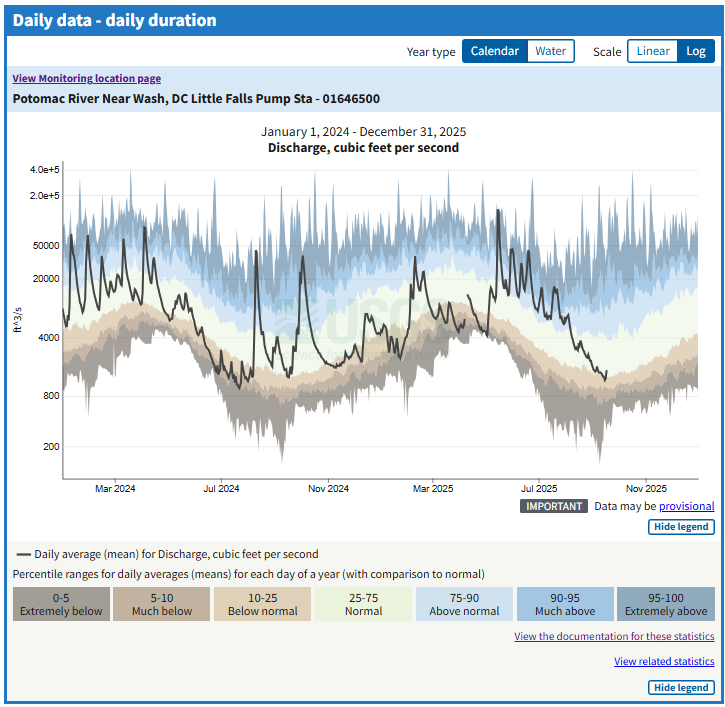
There is another WDFN page where daily data are graphed with statistical data to put the recent values into historical context: MLP: Daily Data Graphs. On these pages, you can see specialty graphs for locations that publish daily mean data for discharge or depth to water level and have a long enough period of record to provide meaningful statistical significance.
The duration graph shows daily mean discharge data along with the day of year statistical percentile ranges for surface water monitoring locations, and daily mean depth to water level data along with month of year statistics for groundwater monitoring locations. This places the recent daily data in context of expected values based on historical data at the monitoring location. An example of the daily duration graph is shown below for monitoring location USGS-01646500 with daily mean discharge data from 2024-2025 (black line) and the day of year statistical percentile ranges.
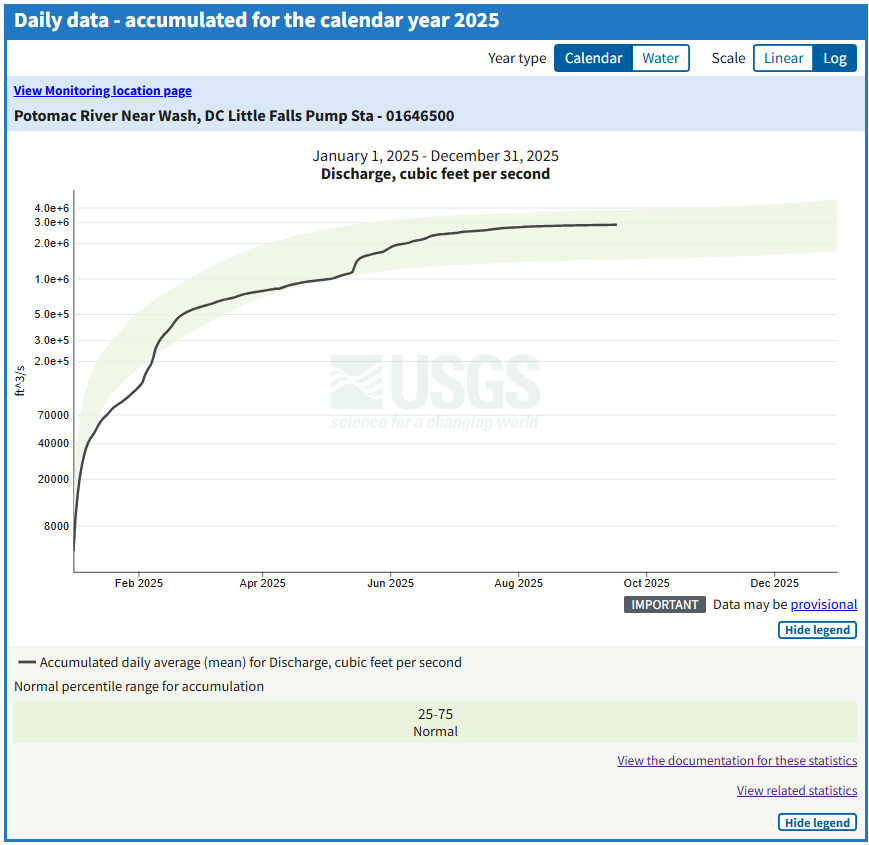
The image to the right shows an example of the accumulation graph for the monitoring location USGS-01646500 with the cumulative daily mean discharge data from 2025 (black line) and the expected “normal” range of values (faint green band).
The graphs included on MLP: Daily Data Graphs were selected based on the most popular features of WaterWatch and GroundwaterWatch. Learn more about the delivery of statistics in WDFN and the decommission of WaterWatch and about how statistics are computed and delivered in WDFN .
Where can I see a table of daily data?
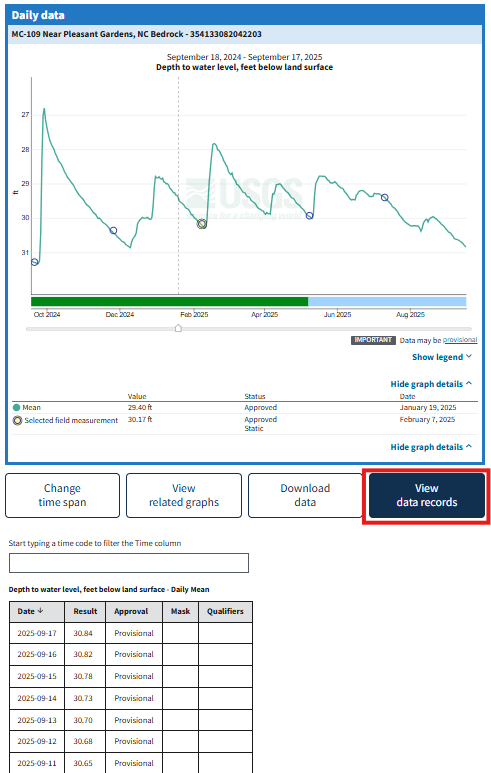
The screenshot to the right shows how you can view the table of data records. Click on the “View data records” action button on the MLP to see the daily data records that are currently shown on the graph. This example from the monitoring location USGS-354133082042203.
Where can I download daily data?
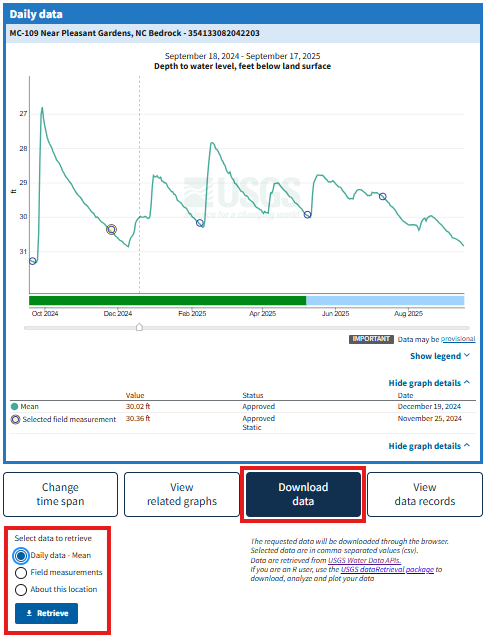
The screenshot to the right shows how you can download a table of data records. Click on the “Download data” action button on the MLP and then select "Daily data". This example is from monitoring location USGS-354133082042203.
How can I access daily data via an API?
You can access daily data and their metadata from the /daily API
on USGS water data APIs. The daily API replaces the legacy daily values service. Data from the API can be returned in several formats, including json, csv, and html.
You can learn more about the new APIs at api.waterdata.usgs.gov , the new hub for all modernized USGS water data APIs. There you will see links to a number of different endpoints, including for other USGS data like the National Imagery Management Service. You’ll also find a Documentation tab that provides a central place for long-form API documentation. Finally, you’ll find a signup form for API keys.
Decommission of NWISWeb
Now that daily data are available throughout WDFN on graphs, in tables, to download, and accessible with the new API services, we have decommissioned the legacy NWISWeb pages that delivered these data and these pages are no longer accessible. In Decommission Campaign 2 , the legacy NWISWeb URLs will be redirected to modernized WDFN webpages when possible, or to relevant resources to help you find the data you were looking for on new WDFN webpages.
Want to know if your webpage will be affected? Look at the URL in your browser window (for example, waterdata.usgs.gov/ca/nwis/dv). For daily data, decommission impacts https://waterdata.usgs.gov URLs that include /dv.
Learn more about the decommission of NWISWeb and stay up-to-date with our decommission timing and progress by following along with the Water Data Blog .
We’re here to help
We understand that change is hard, and some of these changes might feel sudden. We’re here to help. We have staff ready to help you make the transition to using WDFN webpages should you need it. Please reach out to us at gs-w_waterdata_support@usgs.gov with any questions. You can get regular updates about the modernization and decommission effort sent to your inbox by subscribing to the Water Data for the Nation newsletter .
The WDFN websites and services advance the way we deliver water data, and we are focused on continual improvement. Our team uses user-centered design processes to determine what to prioritize next. Let us know how the WDFN pages are working for you by emailing gs-w_waterdata_support@usgs.gov .
Categories:
Related Posts
New Feature - Field Measurements
September 23, 2025
We are excited to announce a new feature on Monitoring Location pages that provide field measurements, which are physically measured values collected during a field visit to a monitoring location.
Modernization of Statistical Delivery and WaterWatch Decommission
June 10, 2025
USGS is modernizing how statistical information is delivered through a suite of new features and products. These are replacing WaterWatch , which offered unique statistics delivery that differentiated it from the core data delivery through legacy NWISWeb. WaterWatch and Water Quality Watch are set to be decommissioned by the end of 2025 as new products become available. This blog details where you can find the statistics previously offered on WaterWatch.
Big changes to USGS Water Data in 2025
May 28, 2025
Public USGS Webinar: Water Data for the Nation – New Features and NWISWeb Decommissioning
In this webinar, we highlight important changes in how we deliver water data. These changes are part of a long-term effort to modernize our Water Data for the Nation (WDFN) systems, improve performance, and better serve both internal and public users.
Metadata in Water Data for the Nation
December 29, 2025
Introduction
Metadata are crucial to interpreting and understanding USGS water data. Metadata are data that provides information about other data. They provide important context to the water data you are viewing on WDFN pages or downloading from USGS Water Data APIs . USGS water data metadata includes codes and abbreviations, such as parameter codes, method codes, and observed properties.
Decommissioning Legacy gwlevels and SensorThings APIs – Fall 2025
September 23, 2025
Background
For over 15 years, the USGS has provided machine-readable and automated access to water data via the WaterServices family of application programming interfaces (APIs), which are hosted at https://waterservices.usgs.gov/ . These APIs underpin all other USGS web delivery products – including products such as the National Water Dashboard and Water Data for the Nation (WDFN) – and have been incredibly effective at delivering water data to the public. Between October 2024 and March 2025 alone, these legacy APIs have handled more than 1.6 billion requests from almost 3.5 million distinct IP addresses.