
Updates and improvements to the National Water Dashboard
New features on the National Water Dashboard include a new experience when clicking a site, Data of Interest to customize your view, and usability updates for your Area-of-Interest.
What's on this page
The National Water Dashboard (NWD) continues to evolve as we modernize our water-data delivery tools and improve how users discover, explore, and interact with real‑time information. Our latest set of updates focuses on simplifying the map experience, improving usability, adding new ways to customize your view, and continuing our long‑term transition away from legacy services. Below is an overview of what’s new.
A new experience when clicking a site
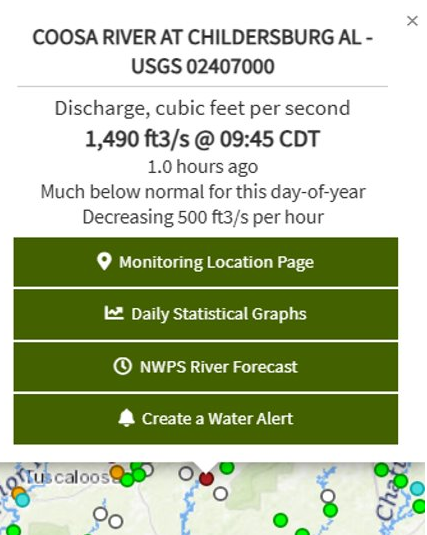
Screenshot of Coosa River at Childersburg AL (USGS 02407000) selected on NWD with similar at-a-glance information on the latest data and trends with new buttons linking to key resources.
Clicking a site on the map now brings up a streamlined set of links on the map instead of opening the NWD hydrograph as a separate window. The at-a-glance information on the latest data and data trends that was available through hover is also available when a location is selected. The NWD's pop-up graphs have been removed, with graphs still available by following the Monitoring Location page link.
The available links change depending on location, with links shown only when the associated page exists. This change helps give quick access to the key resources you rely on:
- Monitoring Location Pages (MLP) where you can find the latest graphs of data
- Daily Statistical Graphs provided through Water Data for the Nation (WDFN)
- NOAA's National Water Prediction Service (NWPS) River Forecasts
- Create a WaterAlert, which allows you to build customized alerts for monitoring locations
- High-Visibility (HIVIS) cameras (where available)
This update kicks off our broader migration away from legacy water services; reducing dependence on older endpoints like Water Service’s /dv service which is expected to be retired in 2027 and eliminating a number of outdated links that no longer worked. Learn more about NWISWeb decommissioning in our NWISWeb Decommission Campaign Summary
blog post
Data of Interest: a new way to customize your view
Different users come to the NWD for different reasons — flood monitoring, drought awareness, local groundwater conditions, and more. To make the tool more approachable for each of these needs, we’ve added the concept of Data of Interest, which updates the map to show only the layers most relevant to a selected theme. This focused view helps users quickly see the information that matters most to their specific situation.
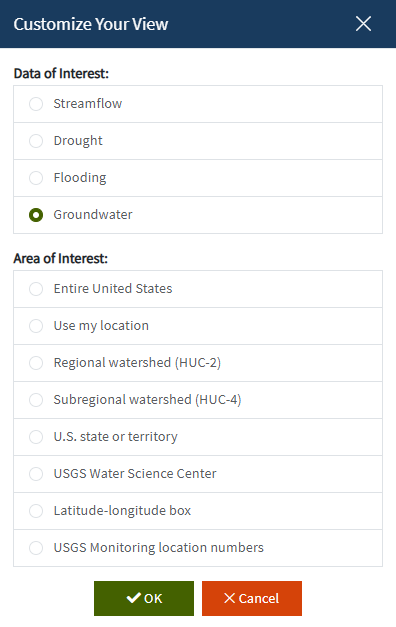
Screenshot of Customize your View with two ways to change how the map appears.
We’ve also combined Data of Interest with Area of Interest to create the Customize Your View menu option, available directly from the map with the Customize button. When making a change, users now select both the data they are interested in (impacting the map layer options) and the area of interest (impacting the geographical area that shows data) in a single action. To apply changes to the map, users must press OK and the selections will be applied to NWD.
The default map is called “Streamflow” and includes all the layers available in the NWD applied across the entire U.S. To return back to the default state, either refresh the page or select a Data of Interest of “Streamflow” and a Area of Interest of “Entire United States”.
Area of Interest (AOI) usability improvements
The Area of Interest feature, now included in the Customize Your View menu, has long allowed users to customize the geographical context for viewing data. Selecting from options such as the user’s current location, a state, or an area drawn on the map. This is a valuable way for users to focus their view on the map. We have heard your feedback on this feature, and with this release AOI now includes several usability improvements:
- Added an option for the Entire U.S. which resets your view to the entire United States, the default view
- Simplified option selection for a clearer, more consistent experience where everything is accessible through a radio button option rather than a set of drop down menus and buttons.
- New watershed selections at the HUC‑2 and HUC‑4 levels
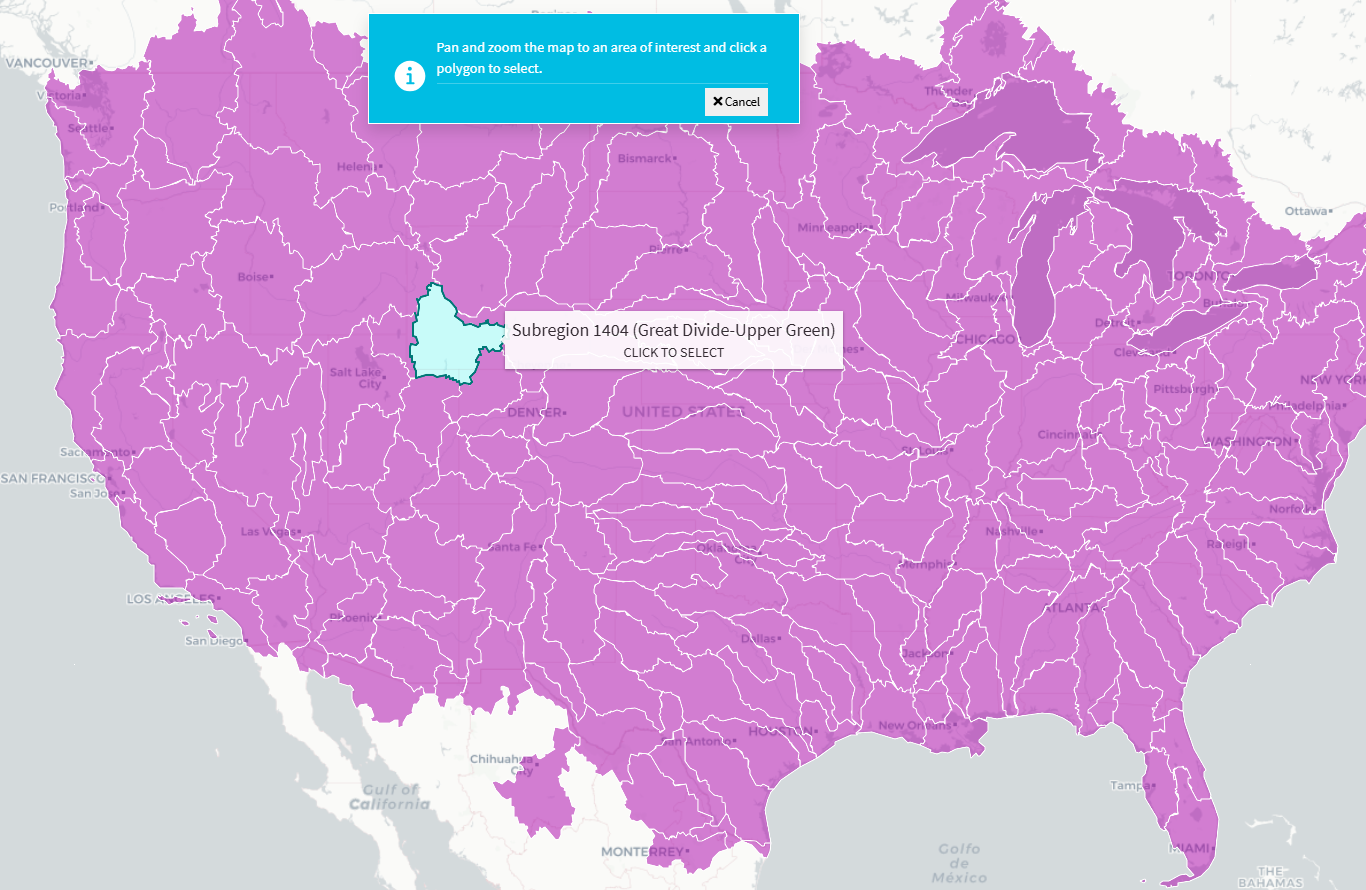
Screenshot of the HUC-4 selection where the HUC-4 the mouse is hovering over turns cyan and is labeled with its name and identifier.
These improvements help users more easily navigate the country’s hydrologic features, whether they’re browsing broadly or zooming in on a specific watershed.
What’s next?
We will be evaluating feedback on the new page as it comes in from our users to find out how the page is working. Our team uses user-centered design processes to determine what to prioritize next. Let us know how the page is working for you by emailing wdfn@usgs.gov .
Categories:
Related Posts
Modernizing How You Access Water Data | Webinar on Oct 13 | Recording Available
October 1, 2021
Missed the webinar? Watch the recording
The recording of this webinar can be viewed on the USGS website or on the USGS YouTube channel .
How we work on the Water Data for the Nation Team
March 9, 2021
The USGS Water Mission Area (WMA) is the largest provider of real time and historical water information in the world. A major part of our work in the WMA Web Communications Branch is to build modern web applications and APIs to make these data publicly available. We call our data delivery product line Water Data for the Nation (WDFN). Here’s our product vision:
Tutorial of dataRetrieval's newest features in R
November 26, 2025
This article will describe the R-package
dataRetrieval, which simplifies the process of finding and retrieving water from the U.S. Geological Survey (USGS) and other agencies. We have recently released a new version ofdataRetrievalto work with the modernized Water Data APIs . The new version ofdataRetrievalhas several benefits for new and existing users:Daily data in Water Data for the Nation
November 21, 2025
There have been a lot of changes to how you access USGS water data as we work to modernize data delivery in WDFN and decommission NWISWeb. As we centralize and re-organize data delivery in WDFN, we have recently set out to describe different types of water data according to data collection categories . We started with re-organizing and expanding the data collection categories that are delivered on the Monitoring Location Page and are now working to deliver additional data collection categories on other WDFN pages as well. This blog is part of a series to help orient you to where you can find different types of data in WDFN pages and services. In this post, we want to focus on how you can access daily data in WDFN.
New Feature - Field Measurements
September 23, 2025
We are excited to announce a new feature on Monitoring Location pages that provide field measurements, which are physically measured values collected during a field visit to a monitoring location.