


Peak Measurements in WDFN
Where to find and download peak measurements in Water Data for the Nation
What's on this page
There has been a lot of change to how you access USGS water data as we work to modernize data delivery in WDFN and decommission NWISWeb. As we centralize data delivery in WDFN, we have described different types of water data according to data collection categories. We re-organized and expanded the data collection categories that are delivered on the Monitoring Location Page and are now working to deliver additional data collection categories on WDFN. This blog is part of a series to help orient you to where you can find different types of data in WDFN pages and services. In this post, we focus on how you can access peak measurements in WDFN.
Peak measurements in WDFN
Peak measurements are the maximum continuous discharge and gage height values recorded for the entire water year from October 1 to September 30. The annual peak discharge and peak gage height values may not occur at the same time. Conditions such as backwater, tidal fluctuations, and other local factors can affect the relationship between streamflow and water level, and these conditions are explained by the qualifiers applied to the data value.
We’re still delivering the same data, but how you access and look at data has changed. Annual peak measurements of discharge and gage height are now available on WDFN pages and programmatically from a new Water Data API endpoint. This differs from NWISWeb, where peak measurements were only available through a website and could not be accessed programmatically. Read more about where to find peak measurements in a table, via a download, or through our APIs below.
Viewing peak measurements on Monitoring Location Pages
The primary place to find peak measurements is on the Monitoring Location Page, or MLP, which serves as the hub for all USGS water data collected at a location. You can find a MLP through Explore USGS Water Data, State pages, such as Wisconsin water conditions, or from the index of all MLPs at waterdata.usgs.gov/monitoring-location.
When you scroll to the “Available data” section of the MLP, you will see all the available data types at the location, organized into the data collection categories. You can expand the peak measurement section by clicking “Show these data types” where you will find a table of all annual peak discharge and gage height measurements available from the entire period of record at the location. The table for peak measurements contains the water year (WY) when the peaks occurred, data values, date and time of collection, and any qualifiers. The columns for water year, discharge value, and gage height value can be sorted ascending or descending. This table contains a subset of metadata about the peak measurements, and you can access full metadata for peak measurements from the /peaks API endpoint.
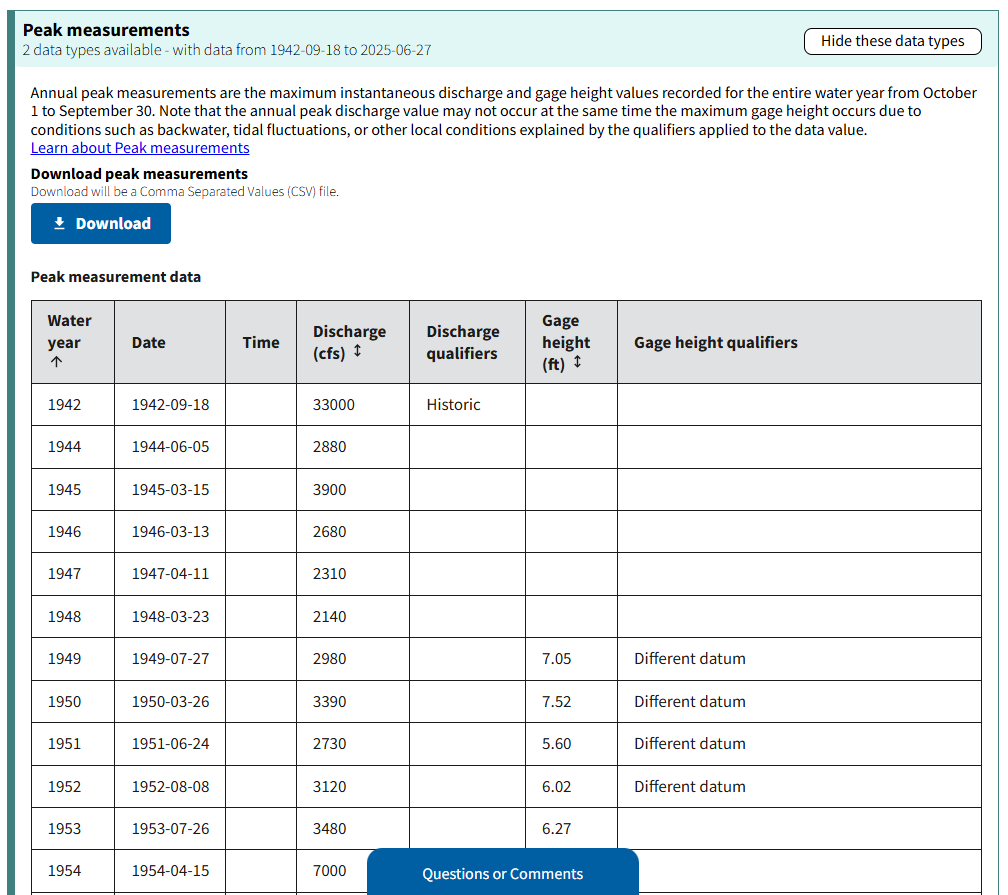
Expand the Peaks section in the list of Available data on the MLP to see a table of annual peak discharge and gage height measurements from the full period of record of the monitoring location. This example from the Eau Galle River at Spring Valley WI (USGS-05370000) shows a table with peak discharge and gage height measurements back to 1942.
Downloading peak measurements
On the MLP, you can download peak measurements from the “Download” button located in the Peaks section in the list of “Available data.” Peak measurements for the full period of record will download as a .csv file. If you would like to download peak measurements for multiple locations from a browser, try out the new Download data form. We are continuing to work on supporting more complex downloads from WDFN pages.
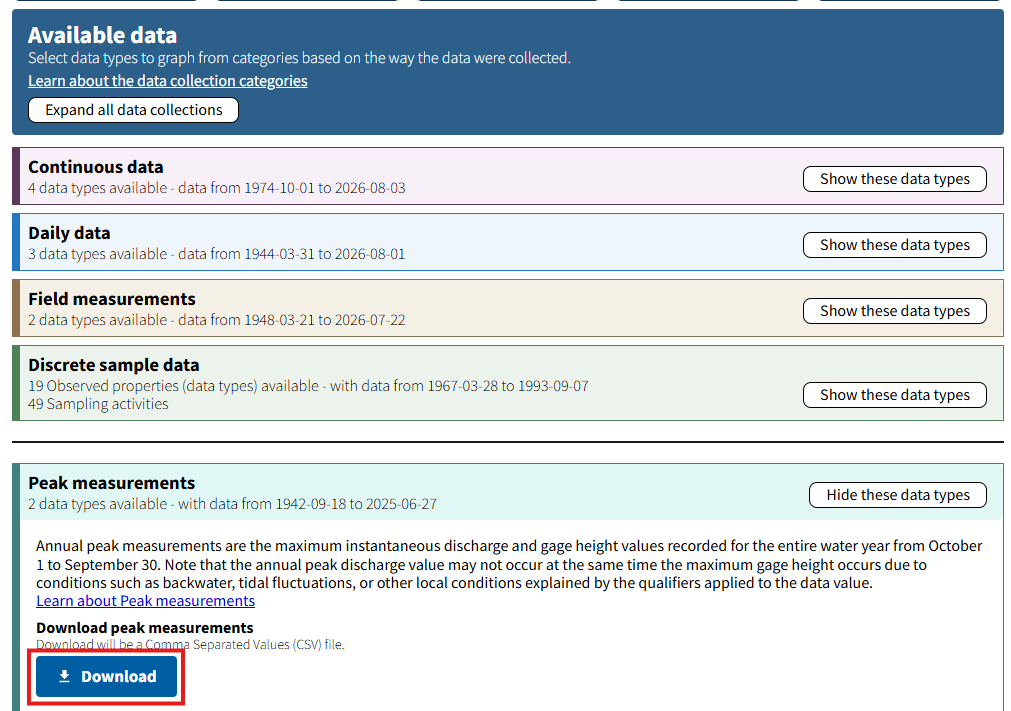
Inside the Peaks section in the list of Available data on the MLP, you can find a Download button that will return a csv file of all available peak measurements of discharge and gage height for the monitoring location. This example from the Eau Galle River at Spring Valley WI (USGS- 05370000) shows how to download the peak measurements.
Accessing peak measurements via API
You can access peak measurements and their metadata from the peaks API in the USGS Water Data APIs. The peaks API is a new addition to the suite of USGS APIs, providing programmatic access to this data type for the first time. Data from the API can be returned in several formats, including .json, .csv, and .html.
You can learn more about the new API at api.waterdata.usgs.gov, the new hub for all modernized USGS Water Data APIs. There you will see links to a number of different endpoints, including for other USGS data like the National Imagery Management Service. You’ll also find a Documentation tab which provides a central place for long-form API documentation. Finally, you’ll find a signup form for API keys, where you can receive your unique identifier needed when downloading a substantial amount of data.
Decommission of NWISWeb
Now that peak measurements are available throughout WDFN in tables, to download, and accessible with the new API, we will be decommissioning the legacy NWISWeb pages that delivered these data. In Decommission Campaign 3, the legacy NWISWeb URLs will be redirected to modernized WDFN webpages when possible, or to relevant resources to help you find the data you were looking for on new WDFN webpages. The legacy URLs will no longer be accessible.
All legacy NWISWeb URLs will be decommissioned in Decommission Campaign 3. Look at the URL in your browser window (for example, waterdata.usgs.gov/ca/nwis/peaks). For peak measurements, https://waterdata.usgs.gov URLs will be decommissioned that include:
/peak/peaks
Learn more about the decommission of NWISWeb and stay up-to-date with our decommission timing and progress by following along with the WDFN Blog.
We’re here to help
We understand that change is hard, and some of these changes might feel sudden. We’re here to help. We have staff ready to help you make the transition to using WDFN webpages should you need it. Please reach out to us at wdfn@usgs.gov with any questions. You can get regular updates about the modernization and decommission effort sent to your inbox by subscribing to the Water Data for the Nation newsletter.
The WDFN websites and services advance the way we deliver water data, and we are focused on continual improvement. Our team uses user-centered design processes to determine what to prioritize next. We are considering different options to display peak measurements elsewhere in WDFN to add context to longer periods of record. Let us know how the WDFN pages are working for you and what enhancements you would like to see for peak measurements by emailing wdfn@usgs.gov.
Categories:
Related Posts
Modernized access for USGS rating curves is now available
August 14, 2026
Modernized access for USGS rating curves is now available
The USGS publishes rating curves describing the relationship between stage and streamflow at a monitoring location. Historically, these curves have been published at the NWISWeb Ratings Depot, available at https://waterdata.usgs.gov/nwisweb/get_ratings.
Modernization of Statistical Delivery and WaterWatch Decommission
June 10, 2025
USGS is modernizing how statistical information is delivered through a suite of new features and products. These are replacing WaterWatch, which offered unique statistics delivery that differentiated it from the core data delivery through legacy NWISWeb. WaterWatch and Water Quality Watch are set to be decommissioned by the end of 2025 as new products become available. This blog details where you can find the statistics previously offered on WaterWatch.
Big changes to USGS Water Data
May 28, 2025
Public USGS Webinar: NWISWeb Decommissioning Campaign 3
NWISWeb launched real-time data pages in 1995 and has hosted more than 7 million annual unique visitors, billions of successful page requests, and terabytes of data delivered. After several years of modernization, we are beginning the final decommissioning or turning off of legacy NWISWeb webpages. This means that pages that you may have relied on for years are going away.
This webinar shared information on NWISWeb Decommission Campaign 3, which will retire all remaining NWISWeb pages and WaterServices. Campaign 3 is expected to be ongoing from November 2026 through February 2027.Announcing V1 of the WDFN APIs
September 4, 2026
Public USGS Webinar: NWISWeb Decommissioning Campaign 3
NWISWeb launched real-time data pages in 1995 and has hosted more than 7 million annual unique visitors, billions of successful page requests, and terabytes of data delivered. After several years of modernization, we are beginning the final decommissioning or turning off of legacy NWISWeb webpages. This means that pages that you may have relied on for years are going away.
This webinar shared information on NWISWeb Decommission Campaign 3, which will retire all remaining NWISWeb pages and WaterServices. Campaign 3 is expected to be ongoing from November 2026 through February 2027.Additional field measurements are coming to WDFN
June 25, 2026
Water Data for the Nation (WDFN) publishes multiple categories of data collected at our monitoring locations, including both data collected by automated sensors and through manual methods. Manually collected data, which we refer to as “field measurements,” are collected during visits to a monitoring location.