
Modernization of Statistical Delivery and WaterWatch Decommission
Modernization and decommission of statistics delivery for USGS Water Data for the Nation
What's on this page
USGS is modernizing how statistical information is delivered through a suite of new features and products. These are replacing WaterWatch , which offered unique statistics delivery that differentiated it from the core data delivery through legacy NWISWeb. WaterWatch and Water Quality Watch are set to be decommissioned by the end of 2025 as new products become available. This blog details where you can find the statistics previously offered on WaterWatch.
This blog post also covers statistics previously available through Groundwater Watch , which was decommissioned in 2022 and new features coming online.
What are WaterWatch, Groundwater Watch, and Water Quality Watch features?
The USGS is the primary Federal operator of hydrologic monitoring
locations that are necessary to understand and predict drought, flood,
and water availability conditions in the United States. Since the
mid-2000s, the USGS has provided real-time geospatial visualizations,
accessed through websites, depicting hydrologic current conditions
benchmarked to historical conditions for streamflow, through Water
Watch, Groundwater Water, and Water Quality Watch. The products are used
by Federal agencies, scientists, and citizens members of the public to
make decisions about local, regional, and national water conditions. The
Water Watches historically provided maps, tables, and plots to describe real-time and
historical hydrologic conditions. Information is updated as new data
become available, at the hourly to daily frequency depending on the
sampling frequency and data transmission rates.
We will provide many of the same features in the modernized water data
products. Below we describe maps, tables, and graphs available for users
of WaterWatch, Groundwater Watch, and Water Quality Watch. We recommend
migrating to the modernized products as soon as possible.
Maps of Latest Conditions
There are two places to see maps with statistical data. The first is the National Water Dashboard , which has multiple layers related to statistics, including high flows and low flows.
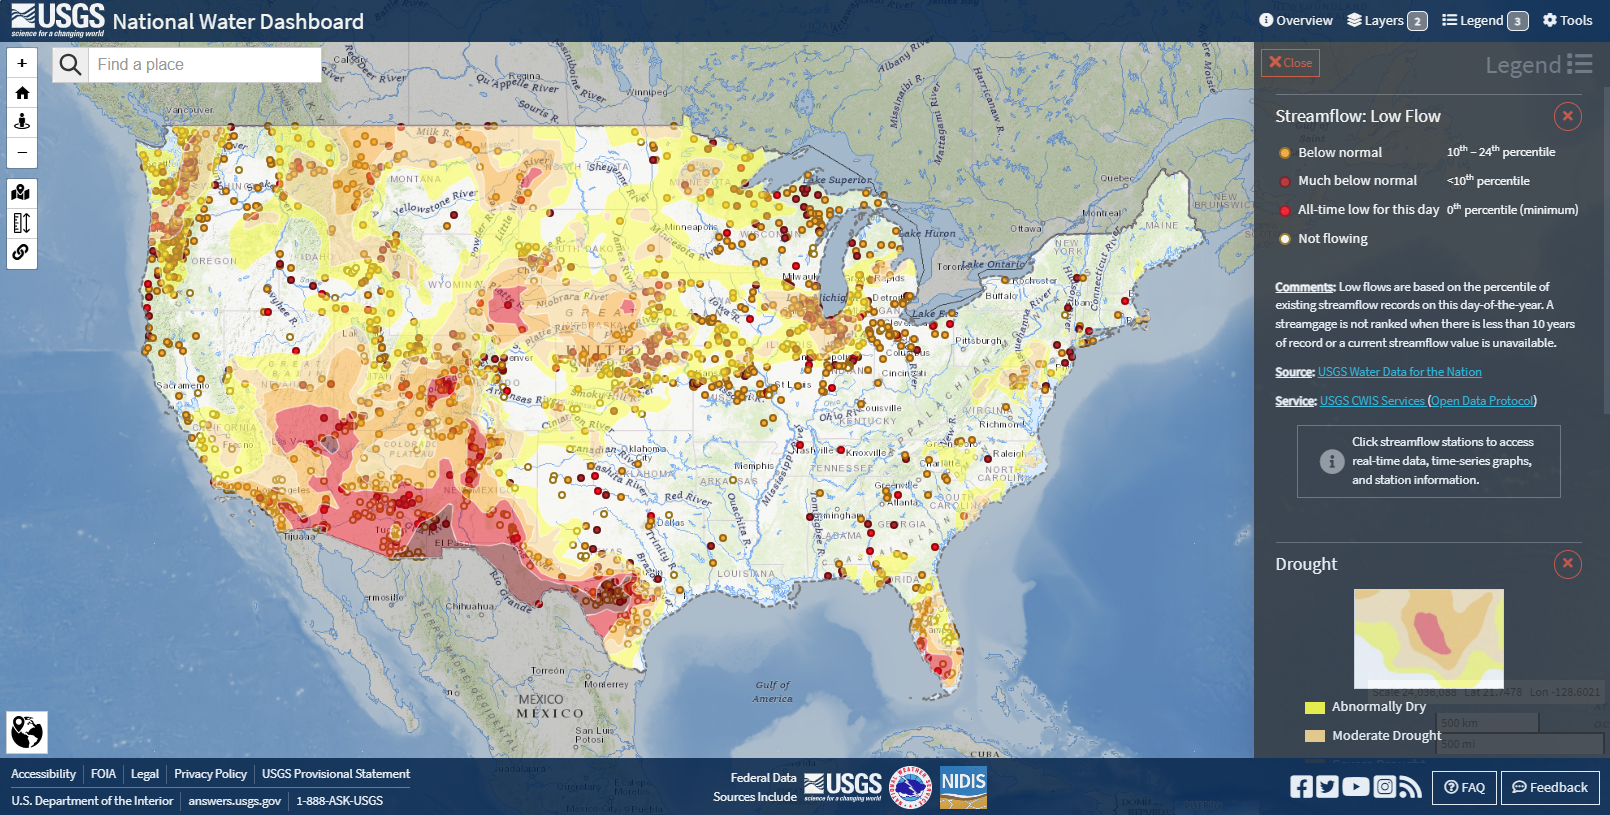
An image of the National Water Dashboard with the drought layer and low flow streamflow USGS stations shown
There are many layers in the National Water Dashboard that help people get a complete picture of what is happening, hydrologically, in their area of interest. These maps are useful during hurricanes and large flooding events, as well as for tracking longer term changes like drought.
The National Water Dashboard also allows people to find and view sites with real-time water quality parameters.
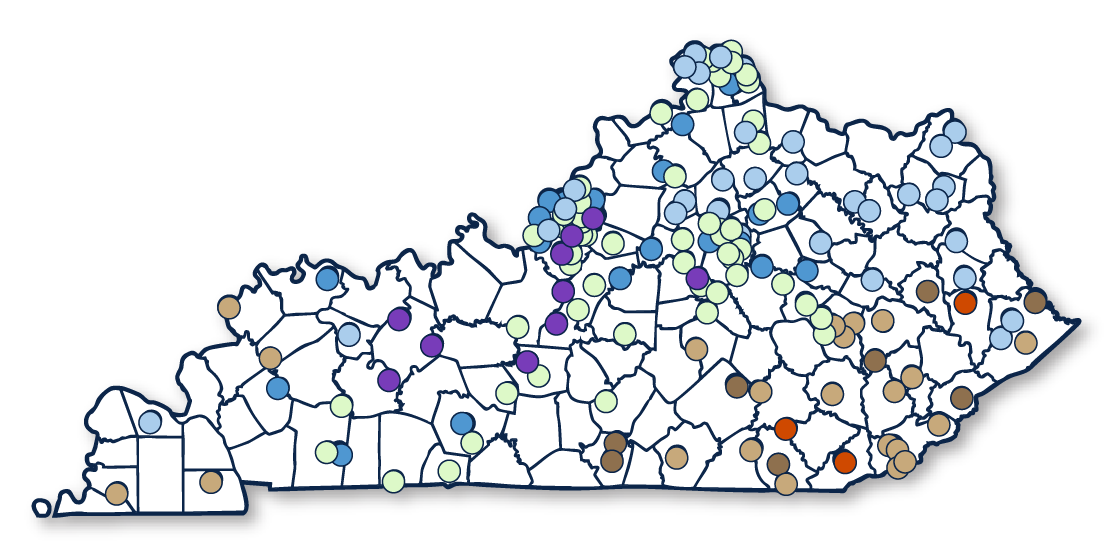
For another map that puts current conditions into historical context, the State Pages in Water Data for the Nation (WDFN) include a map of each state. The default view shows discharge at each streamgage compared to historic daily averages, expressed as percentiles. You can change the data type to view the conditions of different parameters. Access State Pages through the WDFN Home page and read more about the State Pages on our previous blog.
Statistical Graphs and Tables
The Monitoring Location Pages have some statistics already integrated into them. For example, the median can be added to the graph, and a statistics table for the day of year can appear when associated data are available.
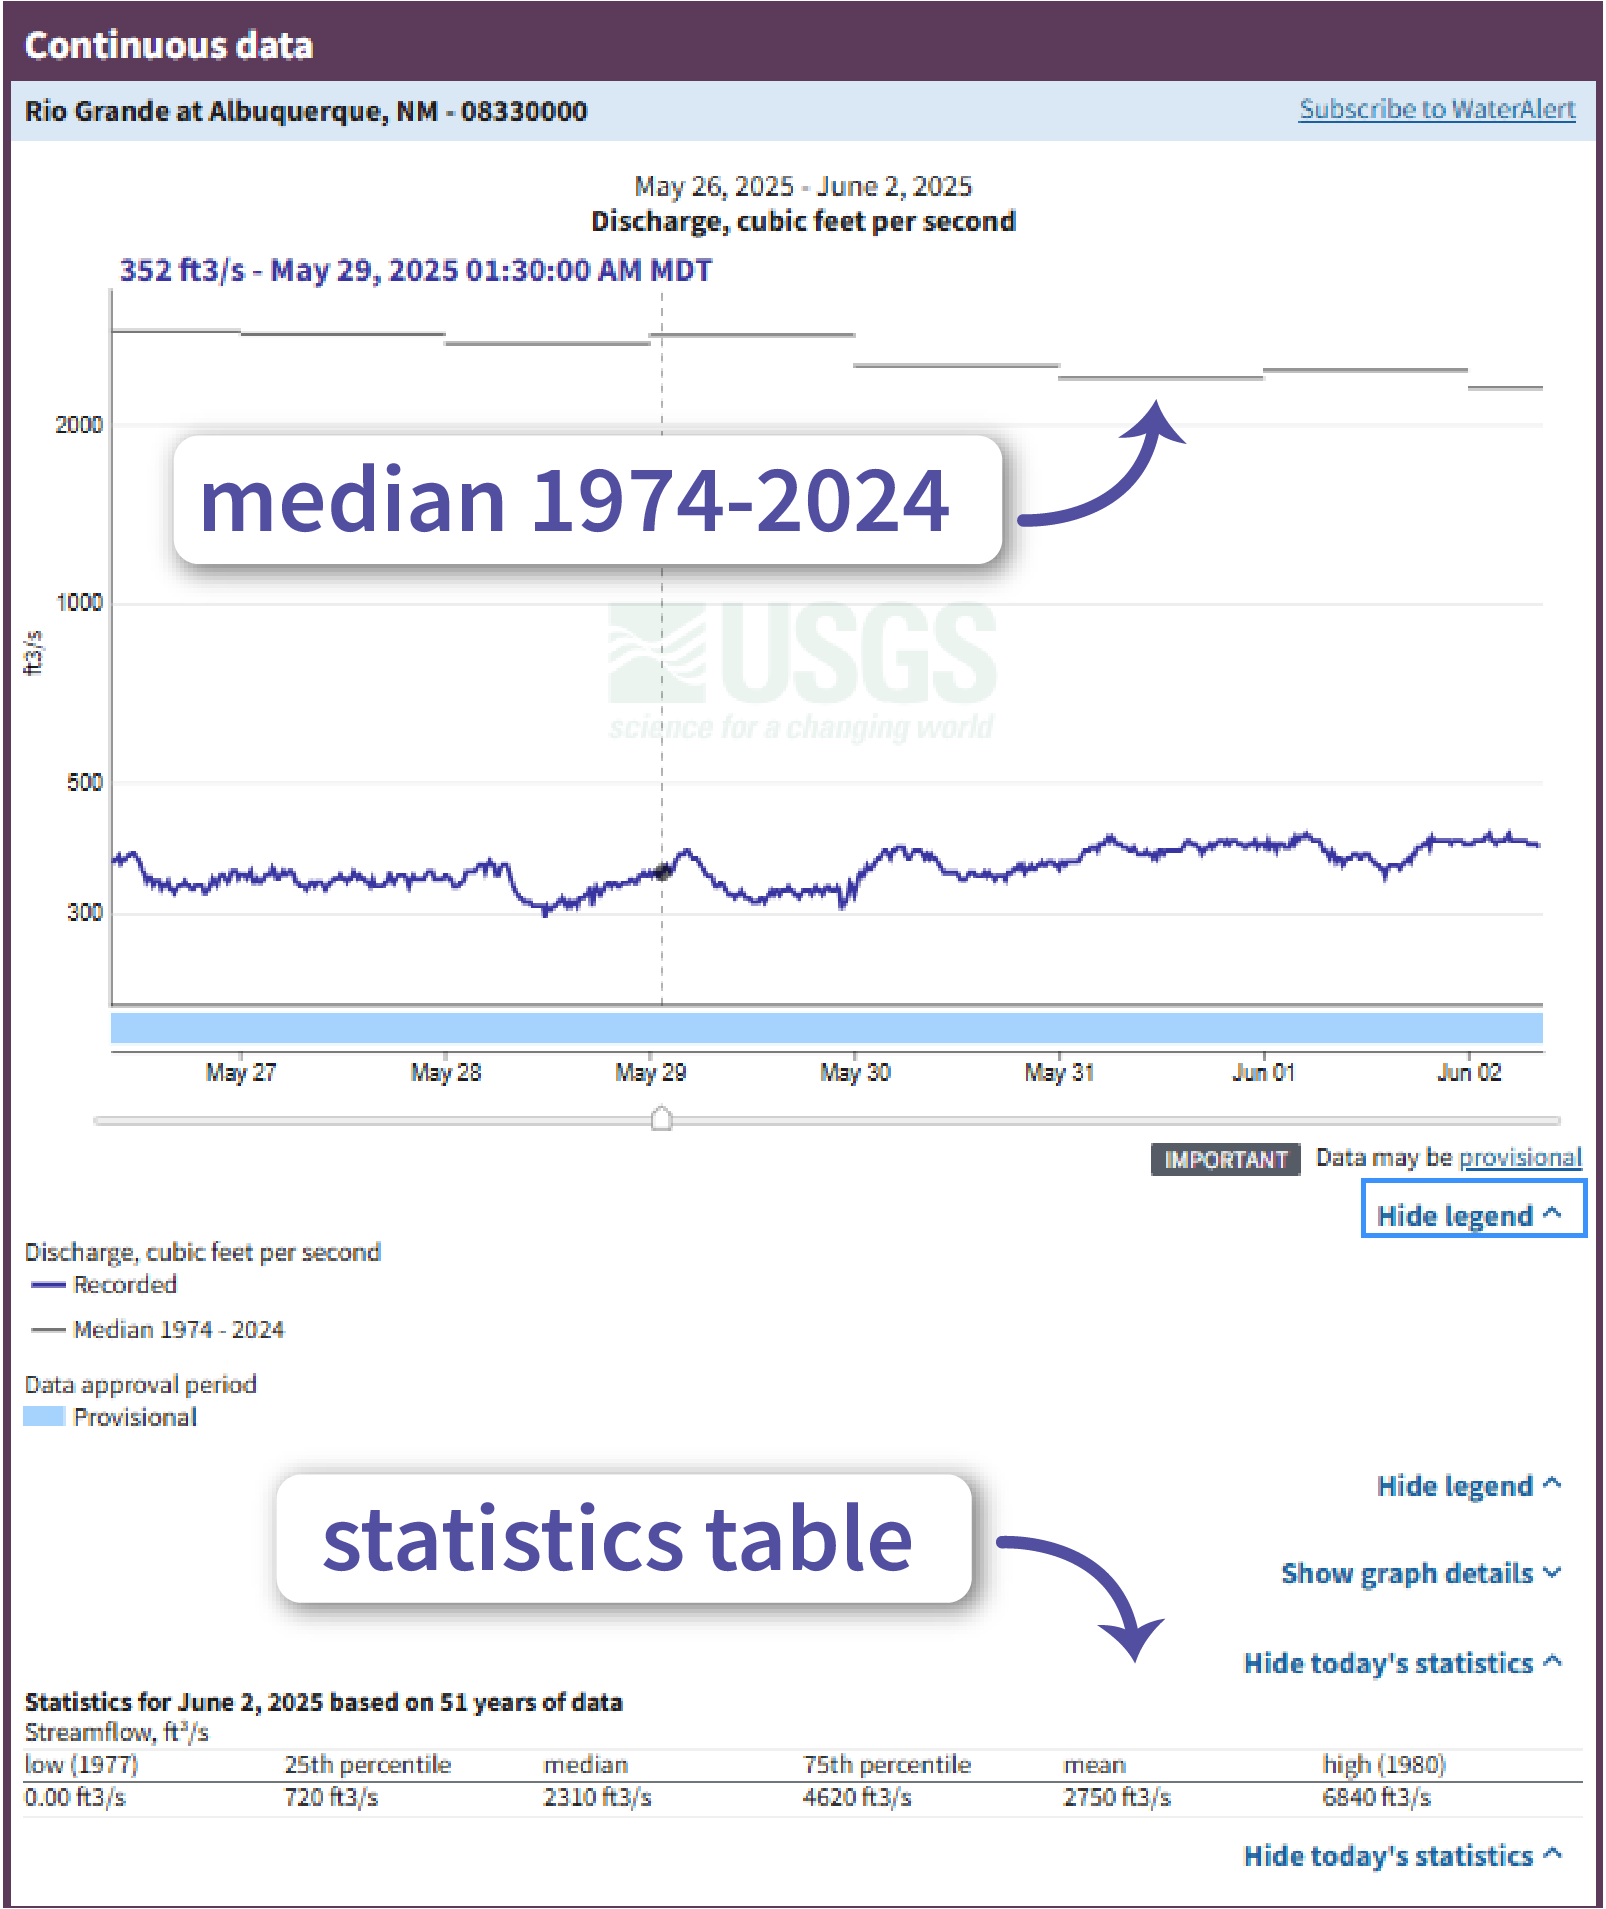
The graph on the Monitoring Location Page for station 08330000 at Rio Grande at Albuquerque, NM shows the continuous discharge values for May 26 - June 2, 2025, with the median discharge values from 1974-2024. Below the graph is a statistics table that shows day of year statistics for June 2, 2025.
New: The WDFN Statistical Graphs and Tables Pages
The WDFN location statistics page is now home of statistical plots and tables for each location that has adequate data. The graphs and tables selected in the first version of this page are based on the most popular features of WaterWatch. The statistical methods are detailed in our statistics documentation .
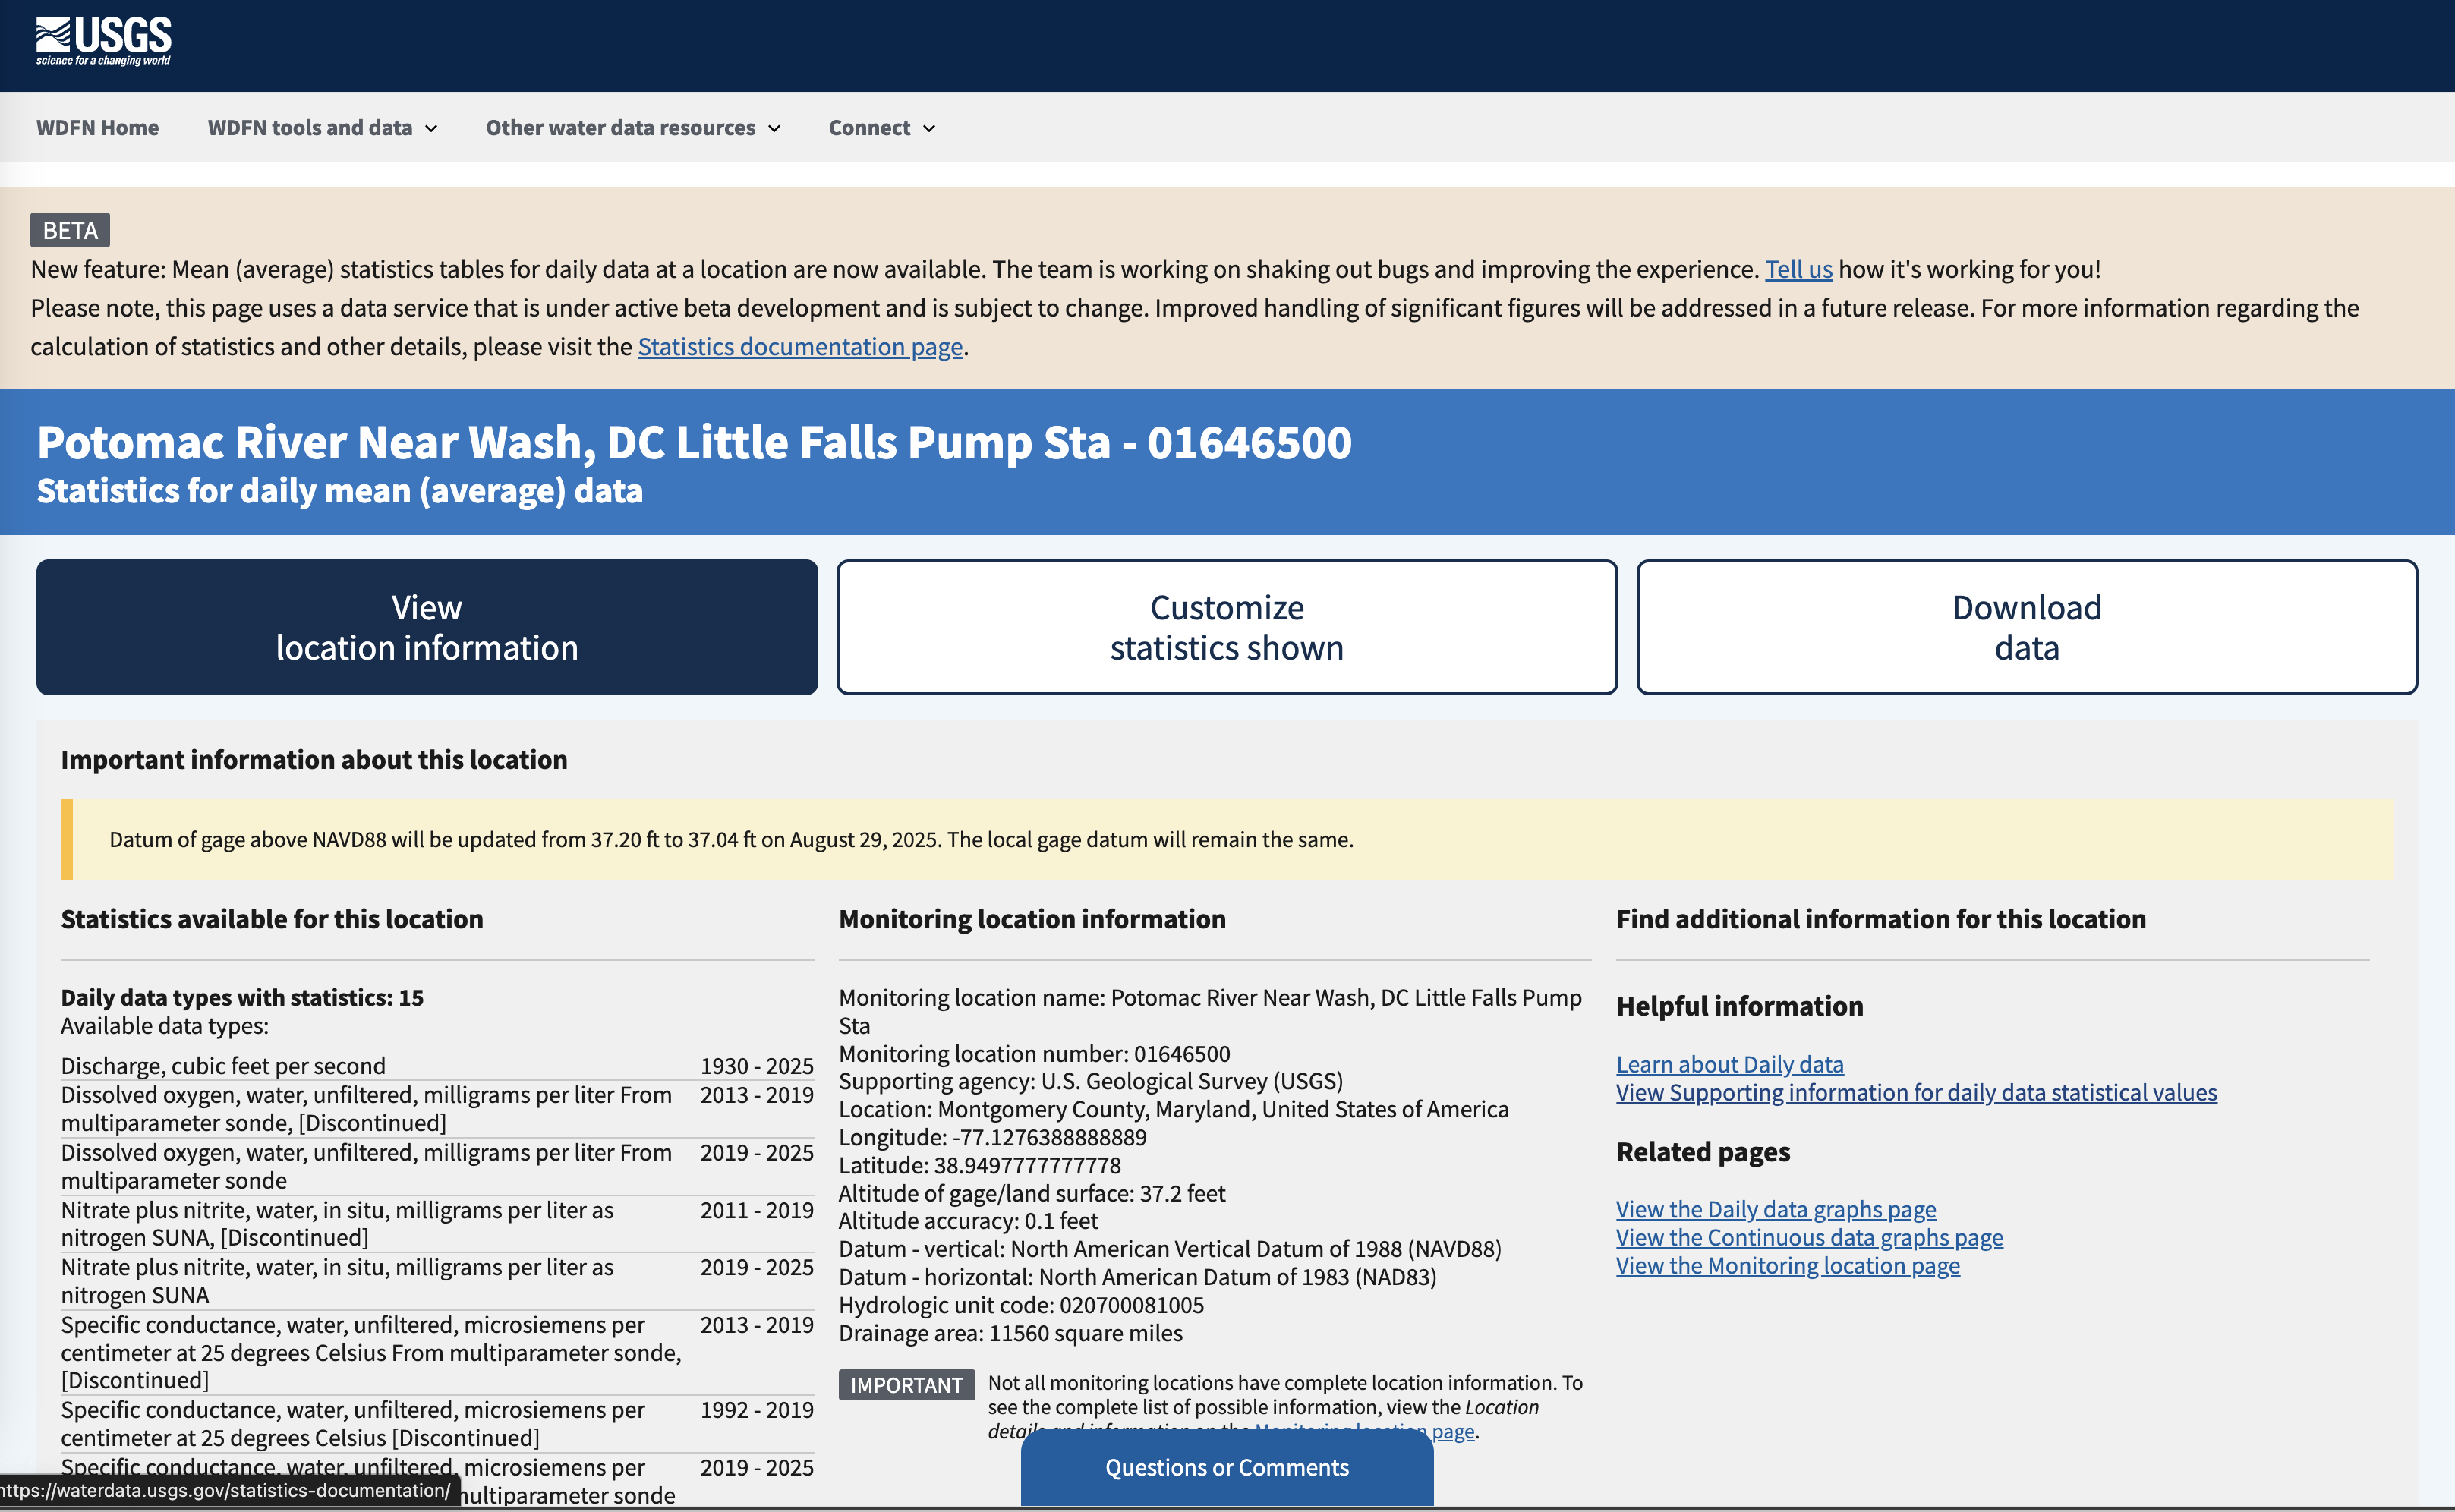
Users can navigate to the statistics page to view various statistic data in tables and download these data to their own environment. View this example statistics page here.
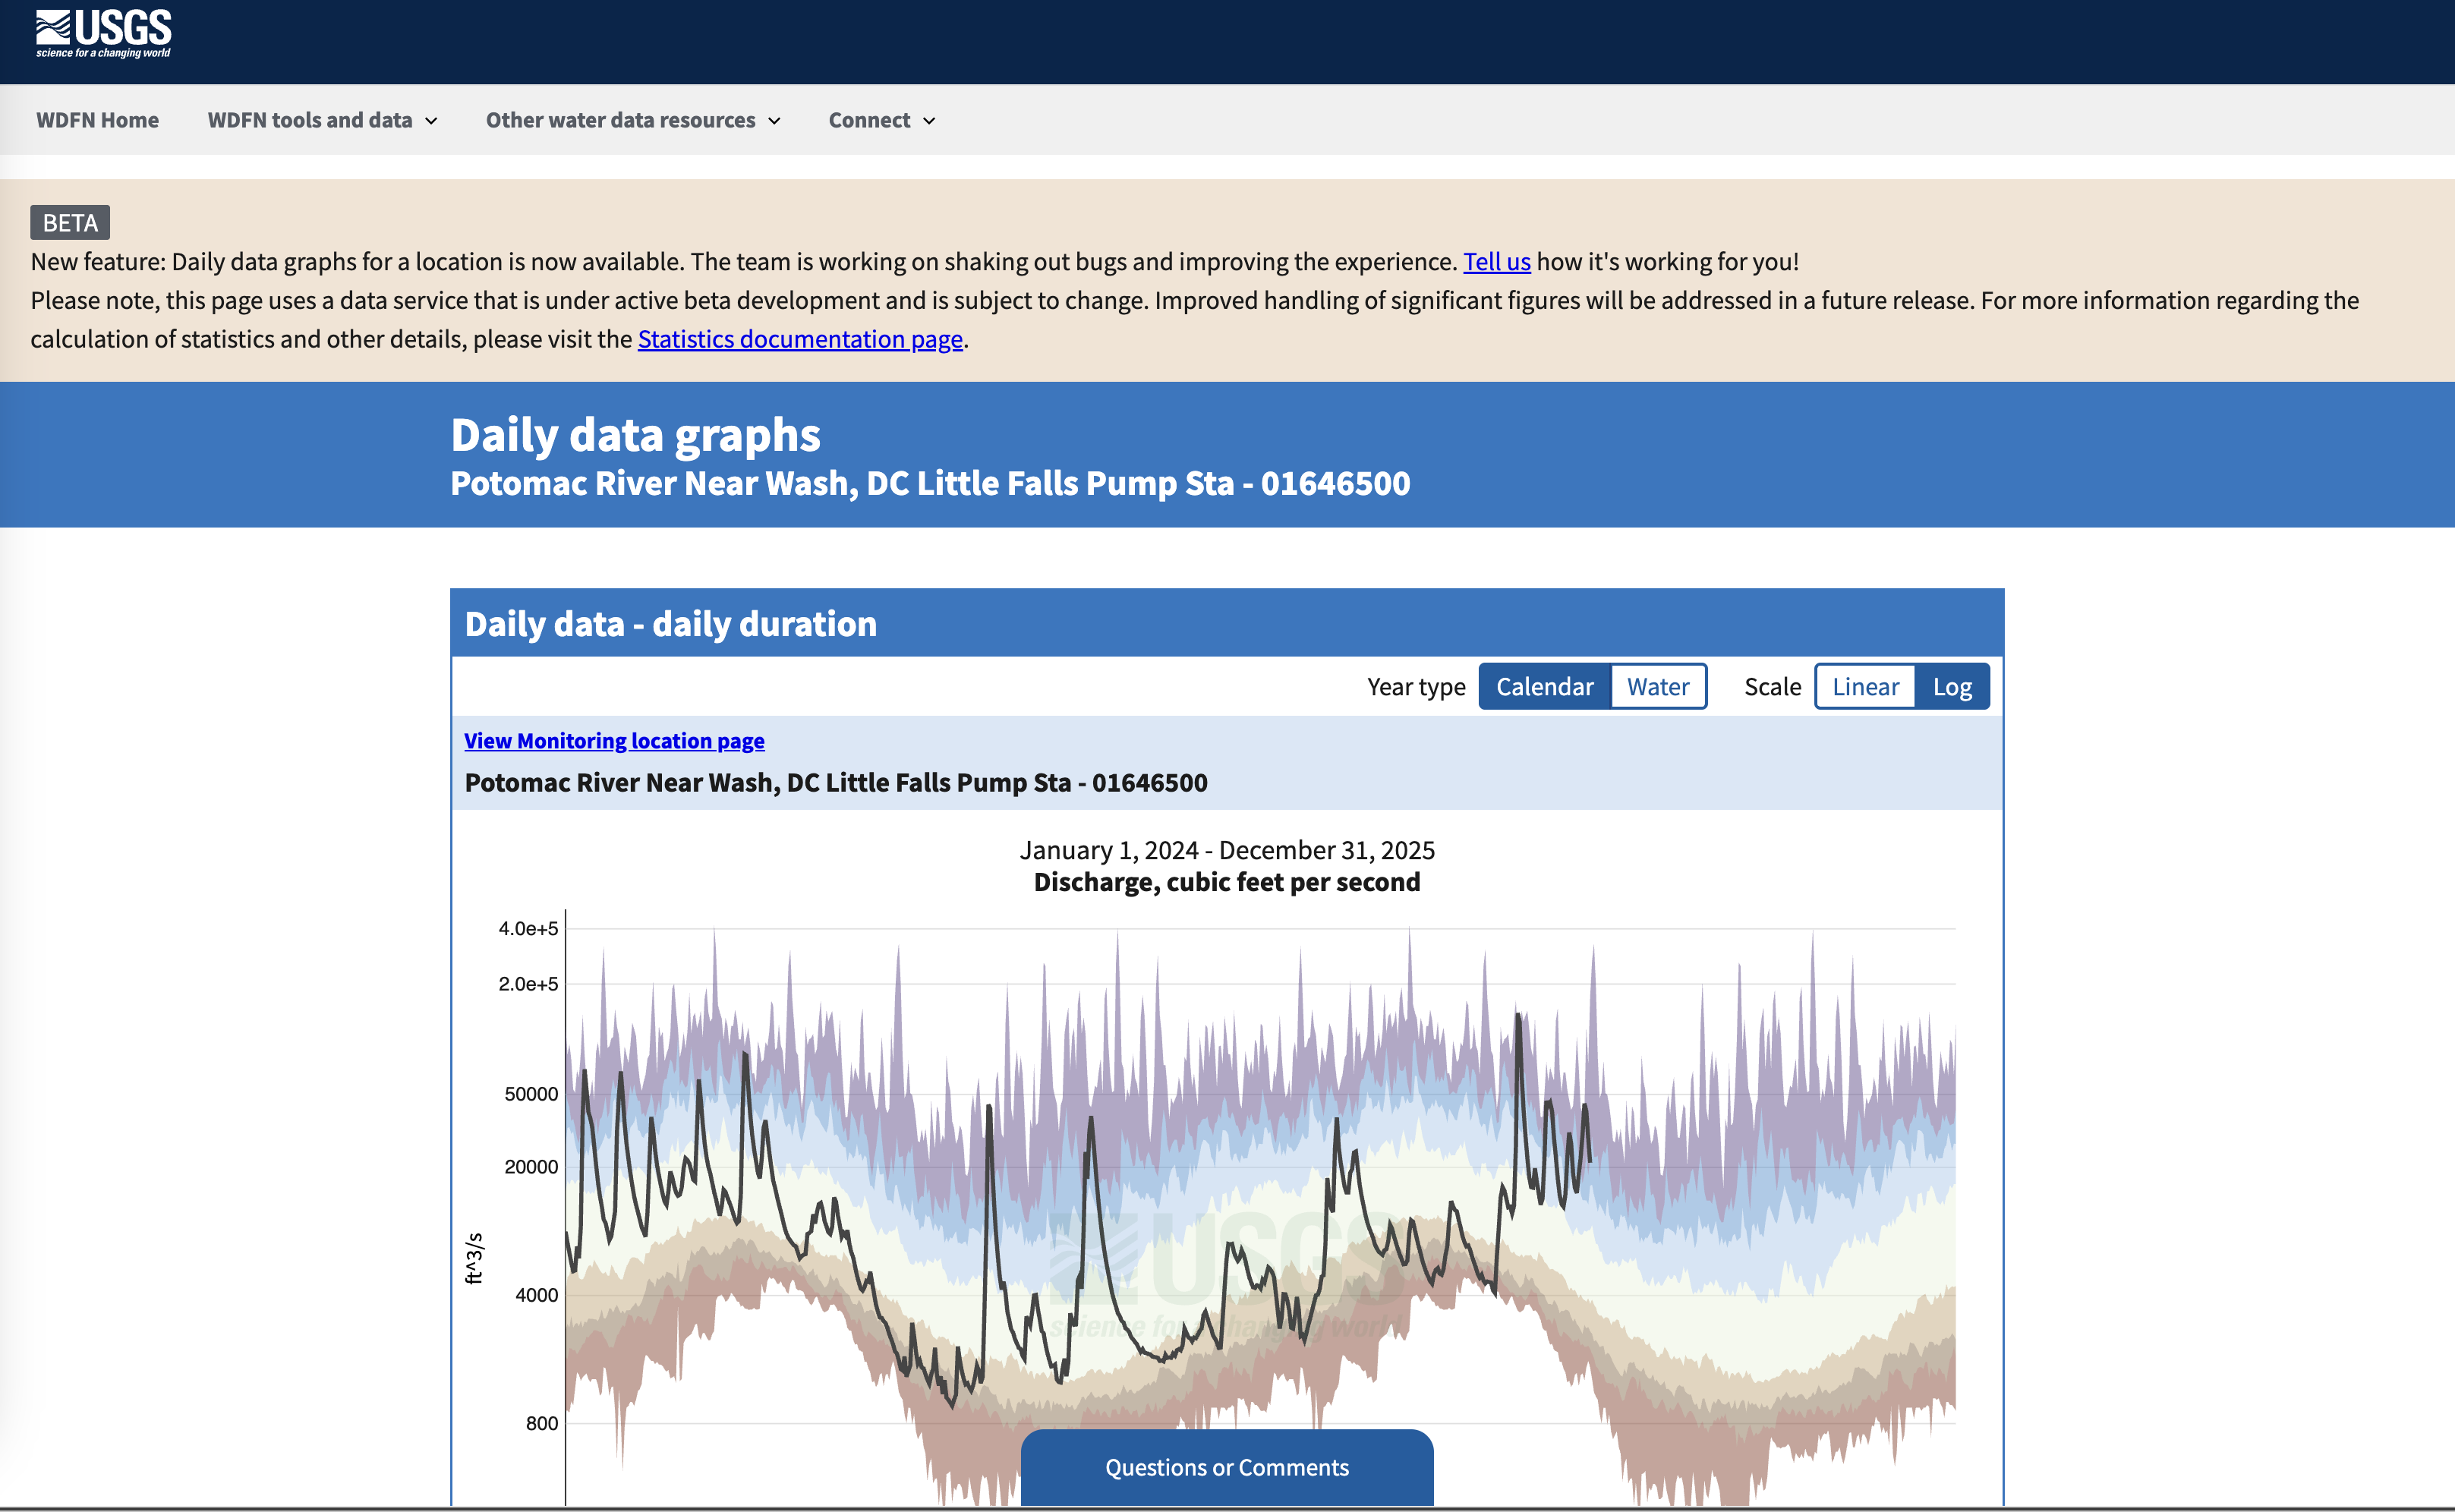
Users can navigate to the Daily data graph page to view a duration hydrograph, which puts current streamflow into the historical context. View this example daily graph page here.
Statistical software packages
WDFN computational tools are utilized by code developers performing analyses or building simple dashboards (e.g. “shiny apps” in R or “dash apps” in Python). All software packages are hosted in USGS GitHub repositories and are available for download from source or using package managers. We’ve got three main tools that can be used on the client side to access and analyze water information in similar patterns to WaterWatch.
dataRetrieval
provides
general USGS water data access including daily values data. It’s available in three
languages: python, R, and Julia.
The Hydrologic Analysis Package
(HASP) enables you to retrieve groundwater level and groundwater quality data, aggregate these data, plot them, and generate basic statistics.
For example, the monthly frequency plot pairs the daily groundwater
level with monthly statistics. Functions are available to customize the
plots or to access the underlying statistics which can be used to power
custom groundwater analysis.
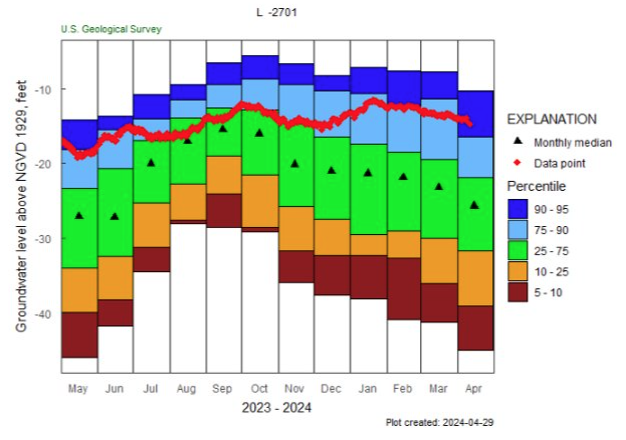
A monthly frequency plot created using HASP
The Hydrologic Surface Water Analysis
Package
(hyswap) is a new library
that performs common statistical calculations on surface water data, such as rolling n-day averages, percentiles, and exceedance probabilities. It also contains basic plotting functions that produce flow duration curves, cumulative hydrographs, raster hydrographs, and streamflow hydrographs. For example, the image below depicts a streamflow duration hydrograph for water year 2024 at a single monitoring location using rolling 7-day averages. The colorful envelopes surrounding the hydrograph represent the different percentile ranges using the built-in “Rainbow” palette: you can choose from a couple built-in palettes or use your own.
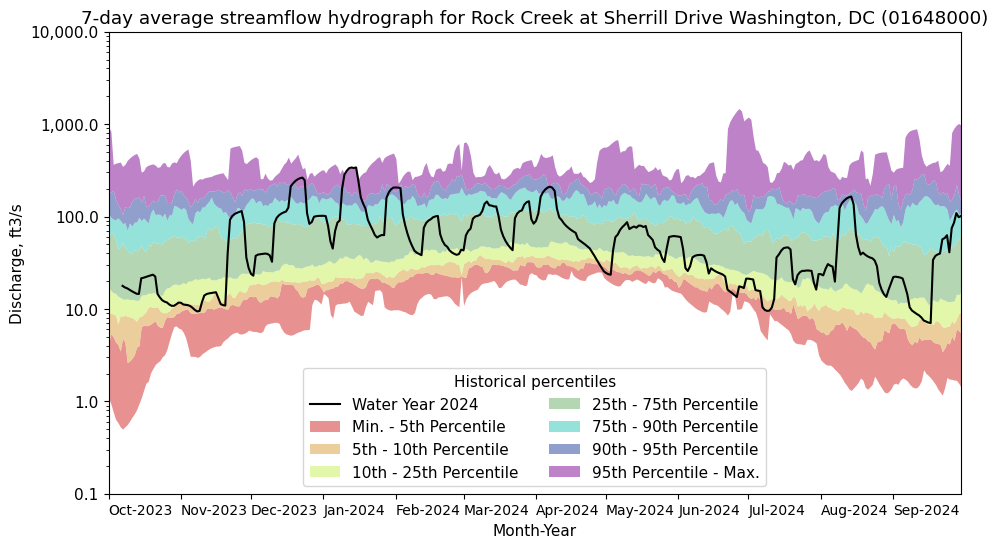
A streamflow duration hydrograph created with hyswap
Similar to HASP, hyswap documentation includes a suite of tutorials including simple examples
for each graph or function. There are also more complicated
example workflows showing how to do things like estimate the runoff for
one or more HUC8s. You can read this blog
post
to learn more
about using hyswap.
WaterWatch and Water Quality Watch Decommission
WaterWatch and Water Quality Watch are expected to be decommissioned by the end of 2025. We’ll do our best to keep the legacy products operational until there are alternatives on WDFN, but unplanned outages on this end-of-life system may occur. We recommend users migrate to modernized products as soon as possible.
The statistics provided on Water Watch and legacy NWISWeb may not always be identical to statistics available through Water Data for the Nation (WDFN). The methodology used to derive statistics and generate plots has changed. These methods are detailed in our statistics documentation . The same logic is used in calculations of statistics across the ecosystem. We encourage users to contact us with any questions.
You can stay up to date on the latest WDFN modernization efforts and new product releases by reading the WDFN blog . This blog post summarizes where to find modernized web pages and services.
We’re here to help
We understand that change is hard, and some of these changes might feel sudden. We’re here to help. We have staff ready to help you make the transition should you need it. Please reach out to us at gs-w_waterdata_support@usgs.gov with any questions. Please subscribe to the Water Data for the Nation newsletter to receive updates about changes to water data delivery and modernization efforts.
Categories:
Related Posts
Big changes to USGS Water Data in 2025
May 28, 2025
Public USGS Webinar: Water Data for the Nation – New Features and NWISWeb Decommissioning
In this webinar, we highlight important changes in how we deliver water data. These changes are part of a long-term effort to modernize our Water Data for the Nation (WDFN) systems, improve performance, and better serve both internal and public users.
Daily data in Water Data for the Nation
November 21, 2025
There have been a lot of changes to how you access USGS water data as we work to modernize data delivery in WDFN and decommission NWISWeb. As we centralize and re-organize data delivery in WDFN, we have recently set out to describe different types of water data according to data collection categories . We started with re-organizing and expanding the data collection categories that are delivered on the Monitoring Location Page and are now working to deliver additional data collection categories on other WDFN pages as well. This blog is part of a series to help orient you to where you can find different types of data in WDFN pages and services. In this post, we want to focus on how you can access daily data in WDFN.
Decommissioning Legacy gwlevels and SensorThings APIs – Fall 2025
September 23, 2025
Background
For over 15 years, the USGS has provided machine-readable and automated access to water data via the WaterServices family of application programming interfaces (APIs), which are hosted at https://waterservices.usgs.gov/ . These APIs underpin all other USGS web delivery products – including products such as the National Water Dashboard and Water Data for the Nation (WDFN) – and have been incredibly effective at delivering water data to the public. Between October 2024 and March 2025 alone, these legacy APIs have handled more than 1.6 billion requests from almost 3.5 million distinct IP addresses.
New Feature - Field Measurements
September 23, 2025
We are excited to announce a new feature on Monitoring Location pages that provide field measurements, which are physically measured values collected during a field visit to a monitoring location.
Water Data for the Nation 2023 through 2025
April 19, 2023
This blog has been recently updated!
In 2025, we refreshed this blog to briefly describe the features that have come out in the WDFN ecosystem since 2023. These updated features are available on the Water Data for the Nation (WDFN) Homepage (https://waterdata.usgs.gov). To learn more about all the updated features, read the blog: Big Changes to USGS Water Data in 2025.