
Big changes to USGS Water Data
Summary of NWISWeb, WaterServices, and WaterWatch decommissions and modernization of APIs and UI for water data delivery
What's on this page
Public USGS Webinar: Water Data for the Nation – New Features and NWISWeb Decommissioning
In this webinar, we highlight important changes in how we deliver water data. These changes are part of a long-term effort to modernize our Water Data for the Nation (WDFN) systems, improve performance, and better serve both internal and public users.
- January 15, 2026
- 2:00-3:00 PM ET
- Watch Recording
Introduction
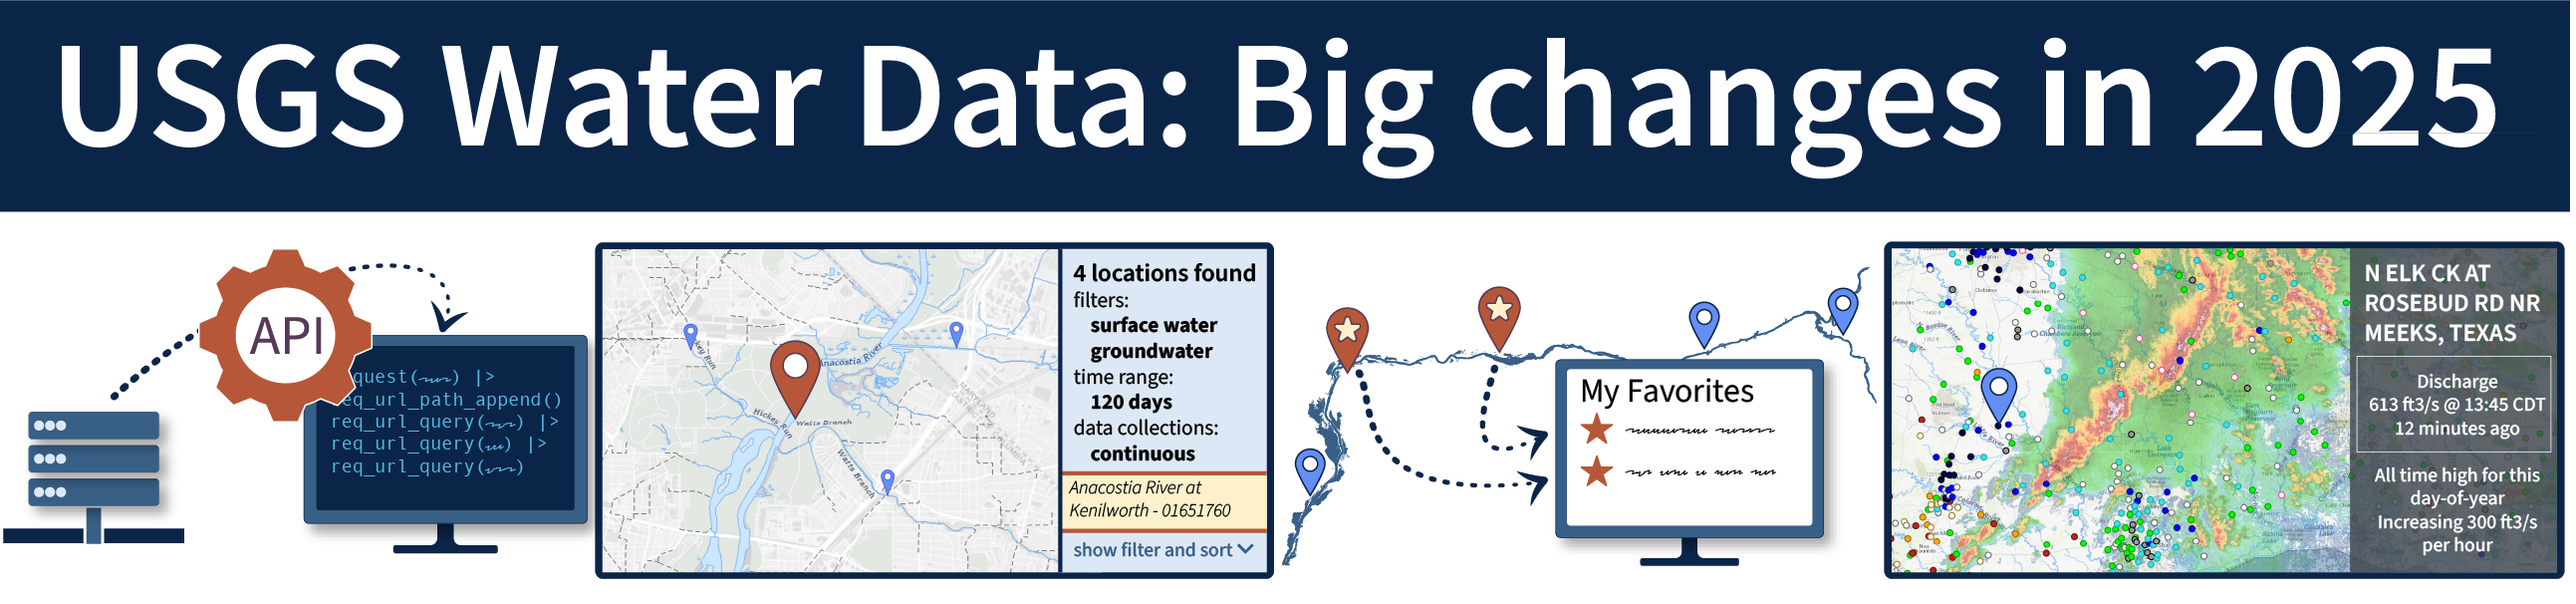
Some of the new features in WDFN for 2025, including API services, explore historical water data, create a list of your favorite monitoring locations, and view latest conditions and weather events.
Big changes are coming to the ways you can access USGS water data in 2025. A number of our legacy products and services will be turned off and we’re excited to unveil the next generation APIs and user interface of the USGS Water Data for the Nation (WDFN) ecosystem.
Three of the legacy USGS Water data products are NWISWeb , WaterWatch , and WaterServices . NWISWeb launched in 1995 providing webpage access to USGS water data. WaterWatch came online in the early 2000s offering various maps, graphs, and tables to explore USGS water data. Then in 2010, Water Services started providing machine-readable and automated access to USGS water data. Since the legacy products were launched, data access patterns, software development tools, and hosting infrastructure have drastically changed. In order to meet cybersecurity and technical requirements, and to provide findable, accessible and usable water data, we are decommissioning—or turning off—the legacy systems and replacing them with modernized web pages and services.
We’re still serving up the same data, but how you access and look at it is going to be a little different. This effort started in 2021 with the new Monitoring Location Pages . Through time we’ve added in-demand features, like daily data , the Combined Location Hydrograph , and All Graphs .
Whether you access USGS water data through user interfaces (UI) or through APIs, the decommission and modernization will impact how you access the data. We’ll be hosting public webinars and trainings to share updates and help in this transition starting in May:
May 29, 2025: Changes coming to USGS Water Data APIs (recording)
This webinar was about updates to APIs and R and Python tools (data retrieval and HYSWAP) to access USGS water data.
January 2026: Water Data for the Nation – New Features and NWISWeb Decommissioning (recording)
In this webinar, we highlight important changes in how we deliver water data. These changes are part of a long-term effort to modernize our Water Data for the Nation (WDFN) systems, improve performance, and better serve both internal and public users.
Below is a short description of the expected impacts, timelines, and features with links to additional information available in previous blog posts.
Decommission plans and timeline
Users access water data through three of our legacy products, NWISWeb, WaterWatch, and WaterServices. NWISWeb is home to all USGS water data accessed through webpages held on the legacy waterdata.usgs.gov. Millions of unique visitors access data through these webpages. While fewer people access data through WaterWatch, the powerful visualizations for statistical calculations hosted on the website are important for many water planning, emergency, and management decisions. WaterServices provide machine-readable and automated access to water data through APIs, and underpin all other USGS web delivery products, such as NWISWeb.
As legacy products are decommissioned, we’re excited to release new webpages and services delivering the same USGS water data. Here’s when they are expected to be available:
| Web page | Features | Release date |
|---|---|---|
| USGS Water Data APIs | - Home for modern APIs | available |
| State Page | - Find locations of interest - See current conditions - Navigate to a Monitoring Location Page - Compare current conditions to historic daily averages | available |
| Explore USGS Water | - Find historical data using a map | available |
| Monitoring Location Pages | - All data collections - Navigate to Combined Location hydrograph, All Graphs, Location Statistics graphs and tables pages | available |
| Monitoring Location Page: All Graphs | - Scrollable page of static graphs - Shows all continuous data types at a location | available |
| Combined Location Hydrograph | - Plot up to 5 monitoring locations and view on a single graph | available |
| My Favorites | - Create custom list of monitoring locations | available |
| My Favorites - graphed | - View multiple data graphs from your favorite locations all on a single page | available |
| National Water Dashboard | - See current conditions and weather events - Add statistical layers | available |
| Download Samples | - Download sample data from manual field collection and lab analyses | available |
| Location Statistics Pages | - View statistics tables (example) - Plot statistical graphs (example) | available |
A complete list of available Water Data API endpoints can be found here .
NWISWeb and WaterWatch are expected to be decommissioned by spring 2026, while WaterServices decommission timeline is still to be determined with expected performance degradation starting in fall 2025. We’ve completed decommission campaign 1 and campaign 2 is beginning now. Visit the blog posts below that go into the decommission plans in more detail:
- NWISWeb decommission campaign 2
- NWISWeb decommission campaign 1
- NWISWeb decommission summary
- What’s new with water data APIs?
- Modernization of Statistical Delivery and WaterWatch Decommission
We’ll do everything we can to keep the legacy products available until there are WDFN alternatives to ensure limited availability gaps. However, legacy products are at end-of-life, and unanticipated impacts may occur without warning. We recommend switching your workflows to use the new pages or services as soon as possible to minimize unexpected issues.
In order to help you transition to the new webpages and services, we’ve provided details below about where to find functionality on the modernized products.
Accessing data programmatically
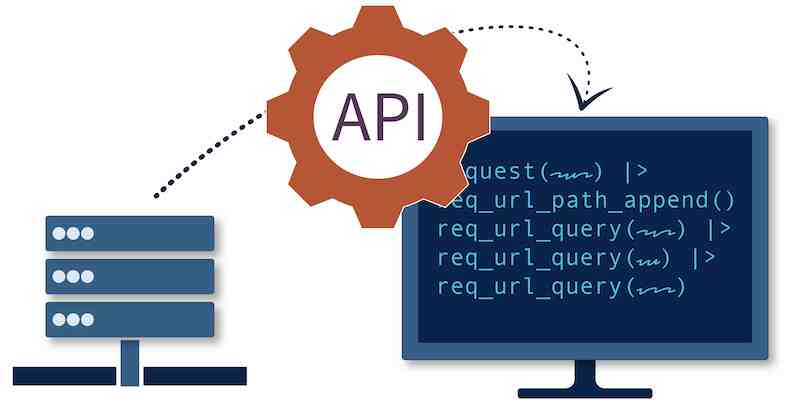
USGS water data can be accessed programmatically through application programming interfaces (APIs) and computational tools for R and Python.
Where can I find new APIs?
While our modernized APIs power all our modernized webpages, the changes will only impact developers who have workloads that use these services. Our new APIs are available through https://api.waterdata.usgs.gov/ . Modernized replacements for all WaterServices endpoints are now available, as well as replacements for lookup tables previously hosted on help.waterdata.usgs.gov . Learn more about API updates by reading our previous blog and watching the May 2025 webinar recording.
The date for the legacy services to be decommissioned is not set, but we recommend migrating your applications as soon as possible. Legacy WaterServices operations will overlap with the modernized APIs to facilitate the transition, however beginning in fall 2025 significant performance degradation is expected on legacy services and it will be necessary to switch over. See the documentation to help migrate your applications.
If you’re using the samples data API , which replaced the qwdata service in 2024 , then you’re already using a modernized API and won’t need to make any changes. The WaterServices statistics service has been redesigned separately to better support Water Data for the Nation. More information about this endpoint can be found at this link .
How can I access data using R or Python?
The data retrieval packages for R and Python provide functionality to access data through the new water data APIs. These packages will be updated as the new APIs are available. See the data retrieval status page for updates to the R package, which will be mirrored in dataretrieval-python . We also offer HYSWAP (Python) and HASP (R) to generate statistical calculations (e.g. exceedance probabilities, daily historic percentiles), and visualize the data (e.g., flow duration curves, streamflow duration hydrographs).
Information about how to access sediment data, including with reproducible R and Python examples, is available on Tips on Accessing Sediment Data blog post.
Maps, graphs, and tables in Water Data for the Nation
The new WDFN UI provides access to water data through maps, graphs, and tables. We’re releasing new features to help users locate a monitoring location of interest, view multiple locations at once, view the latest conditions across the country, and see statistical data. You can find many of these features on the new WDFN Home page .
We will host a webinar in late summer about these new features during summer 2025. This post will be updated with the webinar information when it is available.
How can I find a monitoring location of interest?
We have two new pages that help you find locations of interest:
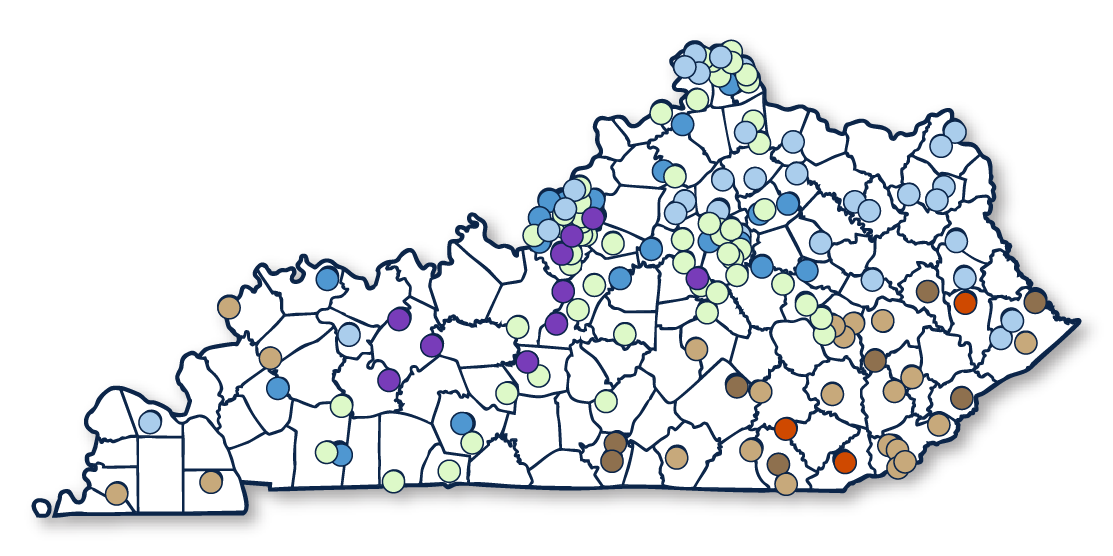
On the State Page you can explore what data types are collected at each location or see locations that collect data types that interest you by filtering the map and list. As of July 2025, you can also now see current conditions as compared to historic daily averages, expressed as percentiles. You can read more about the page on our previous blog post. We're dedicated to continually improving the page, and there are features still to come. These new features include additional data collections in the state and adding water body layers to the map.
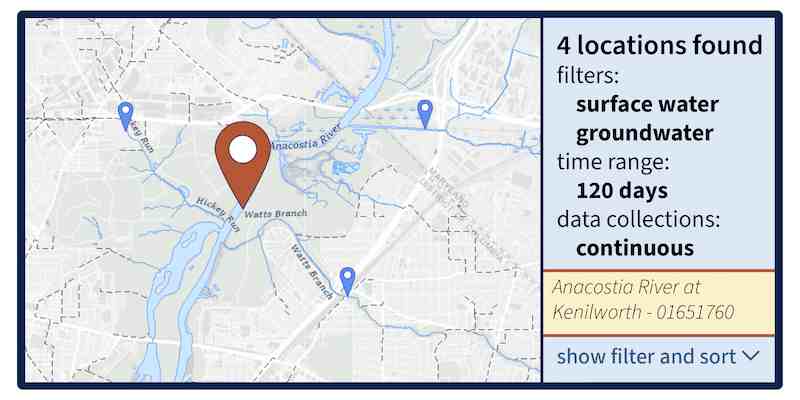
The Explore USGS Water Data page provides the ability to explore both current and historical water data that are available in WDFN. Future improvements of the page will allow searching by additional data collections and refining your search results to download data.
Where can I find graphs and tables of conditions?
The Monitoring Location Page is the hub of all data collected at a gaging station. The Monitoring Location Page can be accessed through any of the exploration pages previously described. The interactive hydrograph allows you to zoom into different periods of interest, see field measurements plotted with the continuous or daily data, compare more than one data type, and customize graph views (example: switch between linear and log scale for discharge).
If you prefer an easy to scroll page of static graphs, we recommend checking out the All Graphs page associated with each monitoring location. You can read about the key feature of All Graphs on this blog post .
Not sure which graph you prefer? This blog post provides an overview of the graphs and compares their features.
Where can I view multiple locations at once?
While many users are interested in conditions at a single location, others want to see how conditions compare or relate at several locations. We have a few tools that help you check conditions at multiple locations.
The Combined Location Hydrograph , accessed through a Monitoring Location Page, allows users to view and share the latest data for up to 5 monitoring locations on a single graph. Learn all about the Combined Location Hydrograph in this blog post .
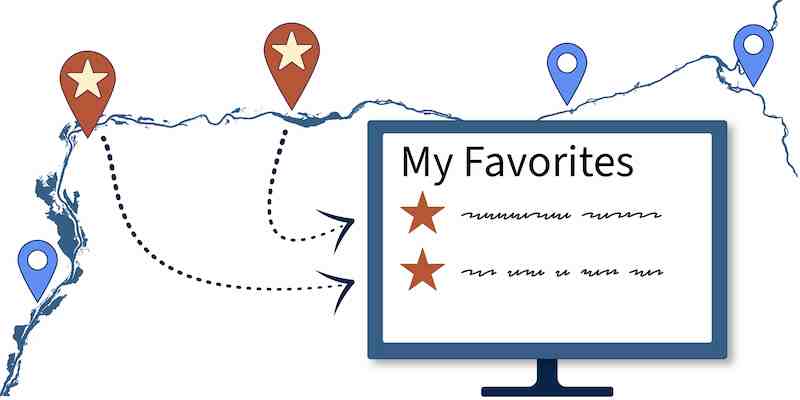
Do you have a list of monitoring locations you frequently check? The My Favorites page allows users to create a custom list of monitoring locations that can be bookmarked and shared for repeated viewings of key locations. Read more about the features at this blog post. My Favorites is also the place where you can view any number of data graphs from all your favorite locations on a single page.
Where can I find statistical context?
On the Monitoring Location Page , you’ll find the median time-series, which can be added to the interactive hydrograph and a table of day of year statistics for available data types.
We now have a location statistics page that contains tables of the daily, monthly, and annual statistics as well as a page highlighting daily statistical graphs which contain highly requested statistical visualizations from WaterWatch. These pages are accessible through the Monitoring Location Page. Read our Modernization of Statistical Delivery blog and our new Statistical Documentation page for more information.
Besides the UI, we offer statistics through several software tools:
- HYSWAP (HYdrologic Surface Water Analysis Package), is a Python package which provides a set of functions for manipulating and visualizing USGS water data. Specifically, HYSWAP includes a number of functions for calculating statistics (e.g., exceedance probabilities, daily historic percentiles) and generating related plots (e.g., flow duration curves, streamflow duration hydrographs).
- HASP (Hydrological AnalySis Package) is an R package to retrieve groundwater level and groundwater quality data, aggregate these data, plot them, and generate basic statistics.
Learn more about water data statistics in our Modernization of Statistical Delivery and WaterWatch Decommission blog post.
Where can I see a map that shows latest conditions as compared to historical values?
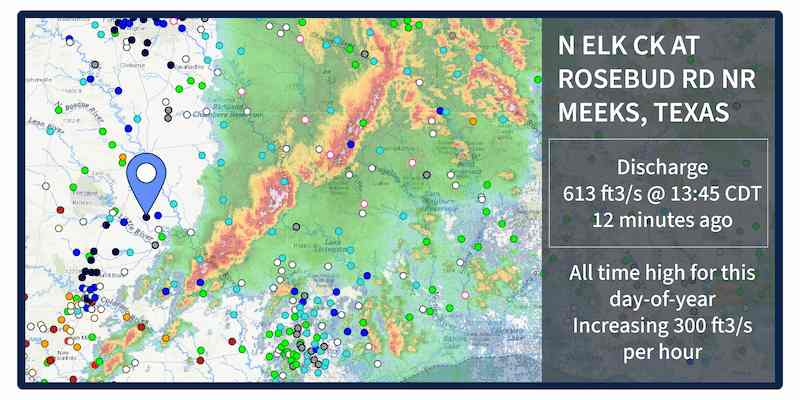
The primary provider of statistical information on maps is in the National Water Dashboard which has several statistical layers, the one shown here being the highest traffic view into the streamflow conditions. National Water Dashboard will be working on some enhancements to provide some pre-built configurations of map layers for easy views into common use cases like flooding or drought.
Simpler maps are also important to provide context when we have lists of locations. Coming soon we will provide a state latest conditions page to provide details on all locations in each state, with the capability to easily change which parameter is shown on the map with statistical context.
Interested in groundwater data? The experimental national web application (GWATLAS2) offers maps of current groundwater levels with historical context, including site-level reports provide quick access to graph and summary data.
Where can I view latest conditions and weather events?
In addition to statistical layers, the National Water Dashboard (see above) also contains several layers to view weather conditions including hurricane cones, radar, and National Weather Service flood status.
For locations with continuous gage height data, Monitoring Location Pages include the National Weather Service flood status to indicate flooding conditions.
Where can I find data not mentioned in the earlier categories?
We are dedicated to continual improvement, and while the legacy pages are decommissioned, the work to improve the modernized pages is not finished. We are regularly adding new features based on user feedback.
Some legacy features such as peaks and ratings do not have a proposed timeline for modernization. These features will be available through the legacy systems.
If you’re not sure where to start, we recommend checking out our new WDFN home page or the new USGS Water Data APIs page. These pages highlight the tools we provide to help you access the water data you need.
We’re here to help
We understand that change is hard, and some of these changes might feel sudden. We’re here to help. We have staff ready to help you make the transition should you need it. Please reach out to us at wdfn@usgs.gov with any questions. You can get regular updates about the modernization and decommission effort sent to your inbox by subscribing to the Water Data for the Nation newsletter .
Categories:
Related Posts
Modernization of Statistical Delivery and WaterWatch Decommission
June 10, 2025
USGS is modernizing how statistical information is delivered through a suite of new features and products. These are replacing WaterWatch , which offered unique statistics delivery that differentiated it from the core data delivery through legacy NWISWeb. WaterWatch and Water Quality Watch are set to be decommissioned by the end of 2025 as new products become available. This blog details where you can find the statistics previously offered on WaterWatch.
Daily data in Water Data for the Nation
November 21, 2025
There have been a lot of changes to how you access USGS water data as we work to modernize data delivery in WDFN and decommission NWISWeb. As we centralize and re-organize data delivery in WDFN, we have recently set out to describe different types of water data according to data collection categories . We started with re-organizing and expanding the data collection categories that are delivered on the Monitoring Location Page and are now working to deliver additional data collection categories on other WDFN pages as well. This blog is part of a series to help orient you to where you can find different types of data in WDFN pages and services. In this post, we want to focus on how you can access daily data in WDFN.
Decommissioning Legacy gwlevels and SensorThings APIs – Fall 2025
September 23, 2025
Background
For over 15 years, the USGS has provided machine-readable and automated access to water data via the WaterServices family of application programming interfaces (APIs), which are hosted at https://waterservices.usgs.gov/ . These APIs underpin all other USGS web delivery products – including products such as the National Water Dashboard and Water Data for the Nation (WDFN) – and have been incredibly effective at delivering water data to the public. Between October 2024 and March 2025 alone, these legacy APIs have handled more than 1.6 billion requests from almost 3.5 million distinct IP addresses.
New Feature - Field Measurements
September 23, 2025
We are excited to announce a new feature on Monitoring Location pages that provide field measurements, which are physically measured values collected during a field visit to a monitoring location.
Additional field measurements are coming to WDFN
June 25, 2026
Water Data for the Nation (WDFN) publishes multiple categories of data collected at our monitoring locations, including both data collected by automated sensors and through manual methods. Manually collected data, which we refer to as “field measurements,” are collected during visits to a monitoring location.