
Water Data for the Nation 2023 through 2025
A look into the current and coming soon features available in WDFN. Updated in 2025 to highlight progress and include links to new features
This blog has been recently updated!
In 2025, we refreshed this blog to briefly describe the features that have come out in the WDFN ecosystem since 2023. These updated features are available on the Water Data for the Nation (WDFN) Homepage (https://waterdata.usgs.gov). To learn more about all the updated features, read the blog: Big Changes to USGS Water Data in 2025.
What is Water Data for the Nation?
Water Data for the Nation (WDFN) is the home for USGS’s modernization of public delivery of water data. USGS water data can be accessed by the public in many ways:
- Webpages to view maps, graphs, and descriptions of water data
- Subscribe to email and text alerts of real-time water conditions
- Download all USGS water data through a variety of download options including programmer-friendly APIs
WDFN is experiencing a lot of growth with many new pages published in the last couple years. We want to tell our users what has become available to help our users discover useful new ways to interact with Water Data for the Nation.
WDFN’s web presence, or “ecosystem” has been separated into 4 categories to help us talk about the purpose of each page. Each category could see new pages in future years, and this diagram highlights our newest features.
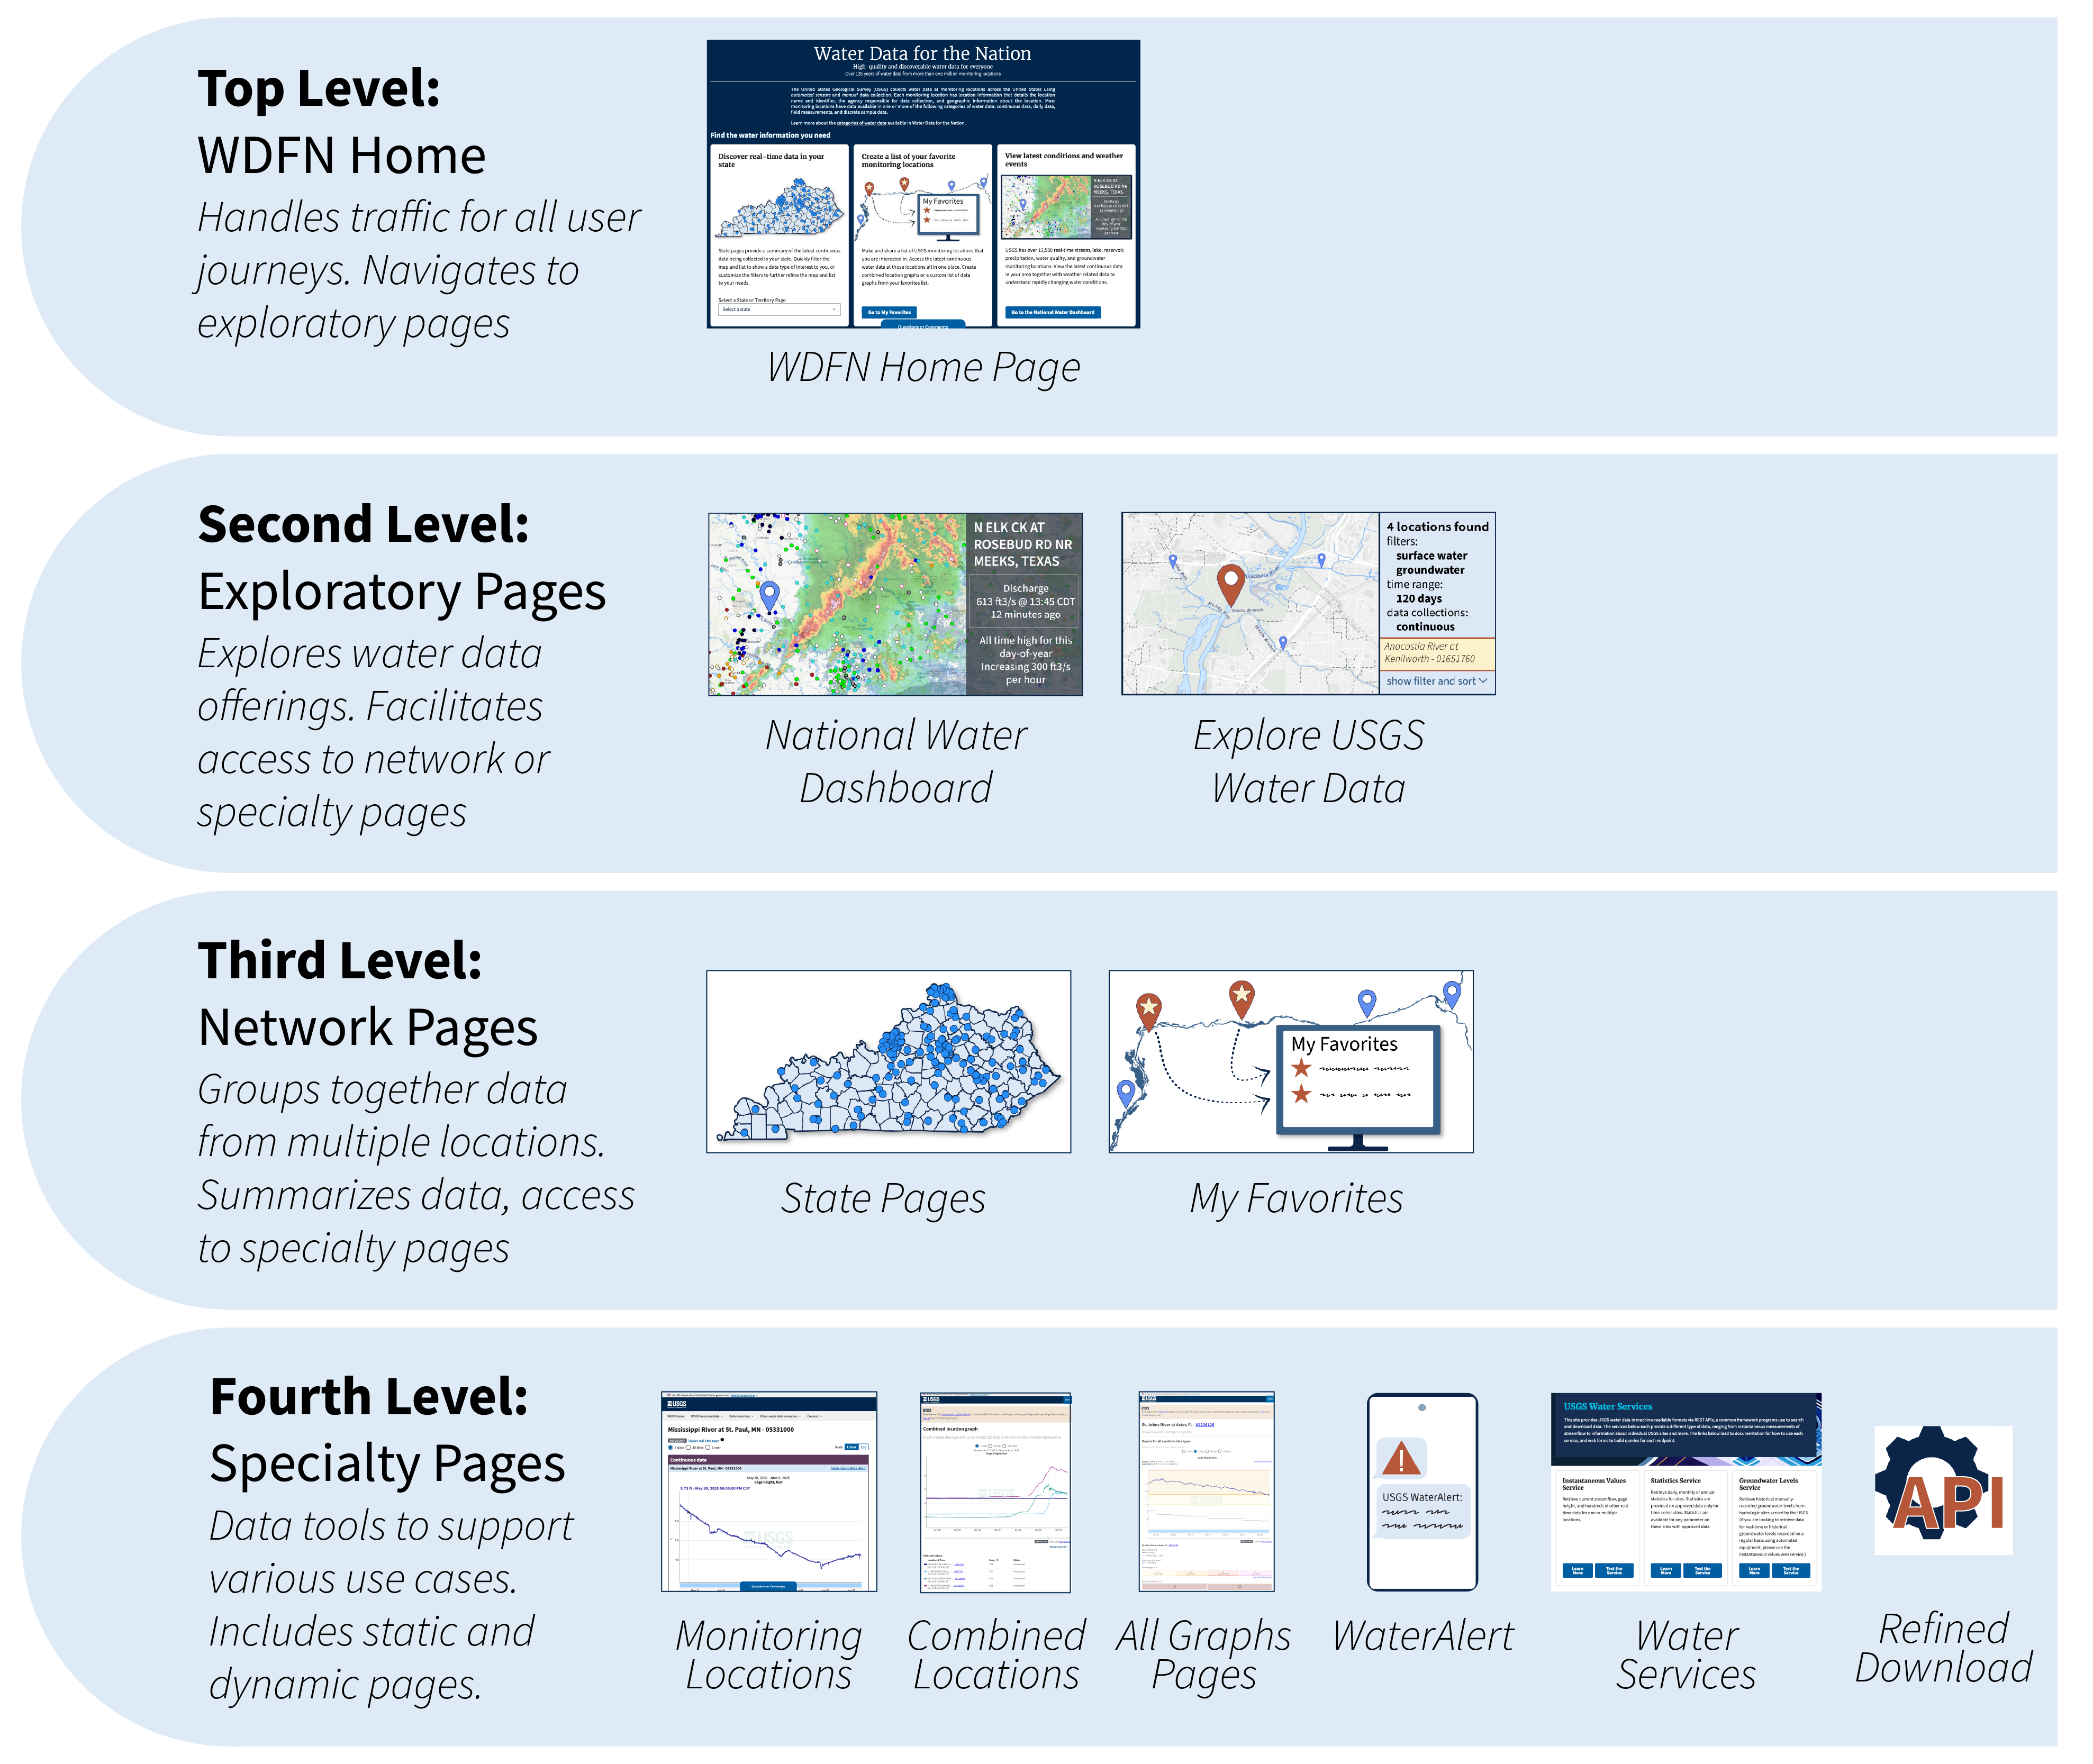
WDFN Features: A summary of all webpages in WDFN, split into four levels with an image representing each page type. This blog describes the updates to and features of each page from the top level through the fourth.
Let’s walk through the different levels in WDFN and what features have been recently updated.
WDFN Home
WDFN Home serves users looking for water data most relevant to them. WDFN Home is a key entry point for discovering water data and exploring other pages.
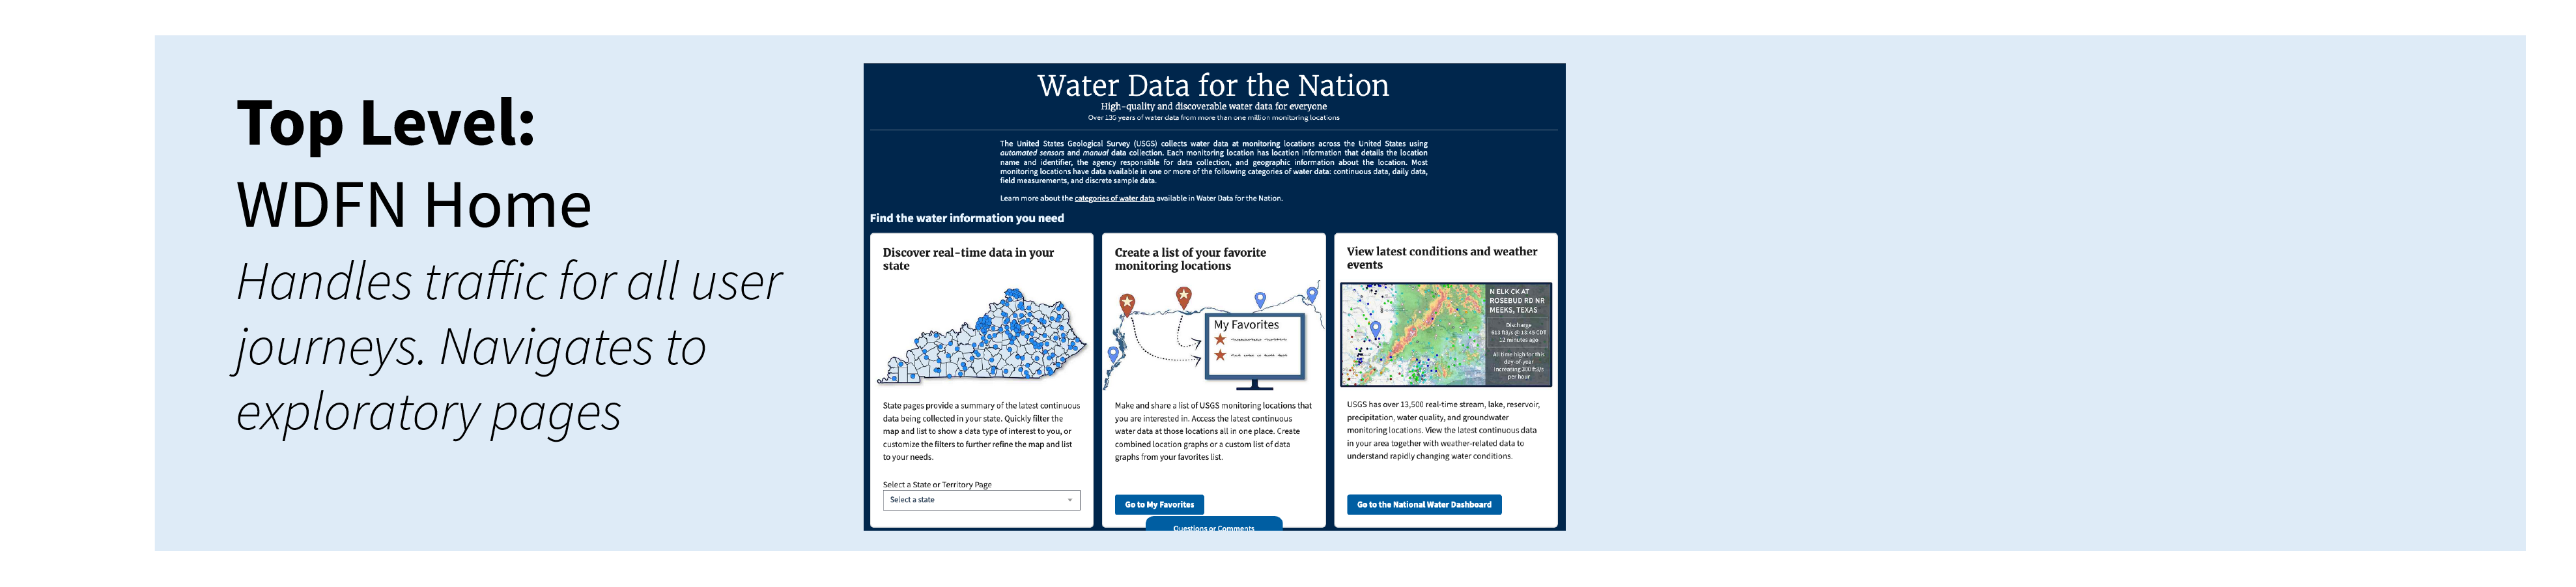
WDFN Home: The new homepage handles traffic for all user journeys. Explore the home page, which contains links to the pages described below, at https://waterdata.usgs.gov/ .
We have published a new WDFN Home Page:
- WDFN Home Page : A new tool to help users who land on waterdata.usgs.gov to navigate to data that is most interesting to them. While legacy is still up, this page is expected to help point users to WDFN and legacy pages of interest. Learn more on our previous blog post
Exploratory Pages
USGS provides public access to a wide variety of data and adds value to those data by providing basic data visualizations, services to download data, descriptions of data and metadata, and supporting documentation. Due to the variety and depth of content offered, the WDFN team’s primary goal is to help users discover the USGS water data. Exploratory Pages are pages designed to help users explore our data. We will likely build more of these pages in coming years as we increasingly provide tools to access, visualize, and use water data.
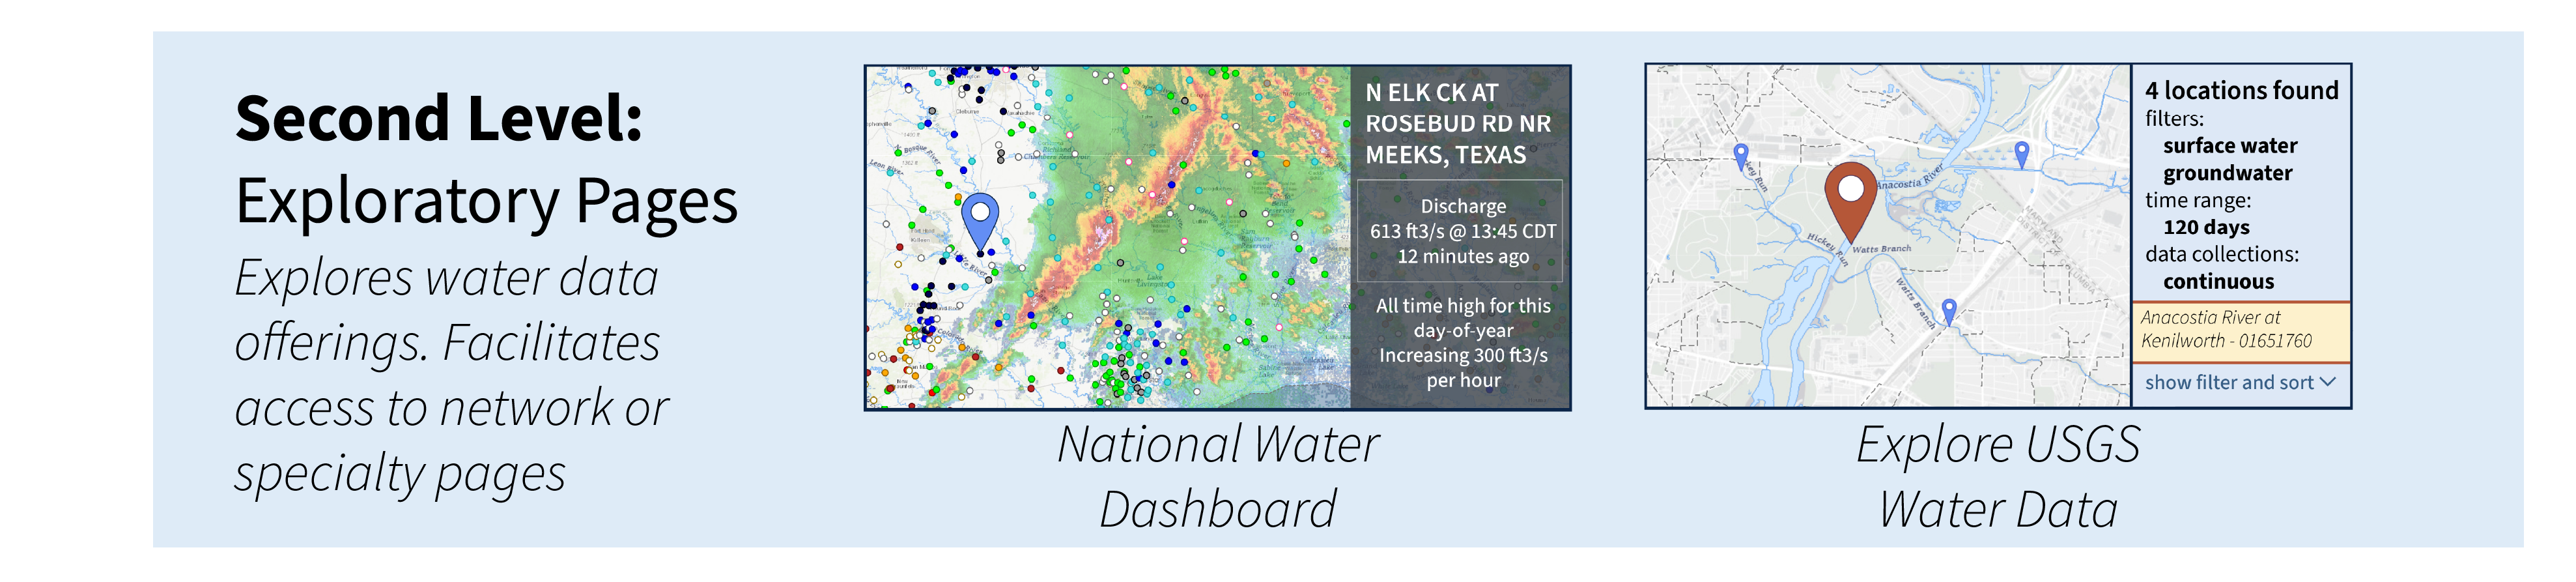
Exploratory Pages: Explore water data offerings and facilitate access to network or speciality pages. Exploratory pages include the National Water Dashboard at https://dashboard.waterdata.usgs.gov/ and the Explore USGS Water Data page at https://waterdata.usgs.gov/explore/
We currently have two map-based exploration tools:
- National Water Dashboard : Allows users to explore the latest water data, using a map with many available map layers including weather and flood forecasts. National trends are easy to understand at a glance based on colors tracking the latest values against historical averages. This tool is available in English and Spanish.
- Explore USGS Water Data : A new tool to explore USGS water data nationwide, finding locations of interest to access the water data. The Explore USGS Water Data page provides the ability to explore both current and historical water data that are available in WDFN. Future improvements of the page will allow searching by additional data collections and refining your search results to download data. Learn more about the features of this page on our previous blog post .
Network Pages
USGS has over 1.9 million monitoring locations which can be grouped in various ways; by geography, by funding networks, by water feature. Network Pages allow users to access links to multiple monitoring location data pages simultaneously. The focus was on customization to supplement the legacy offerings and learn more about what works for our users. We look forward to adding more functionality to these pages as they mature.
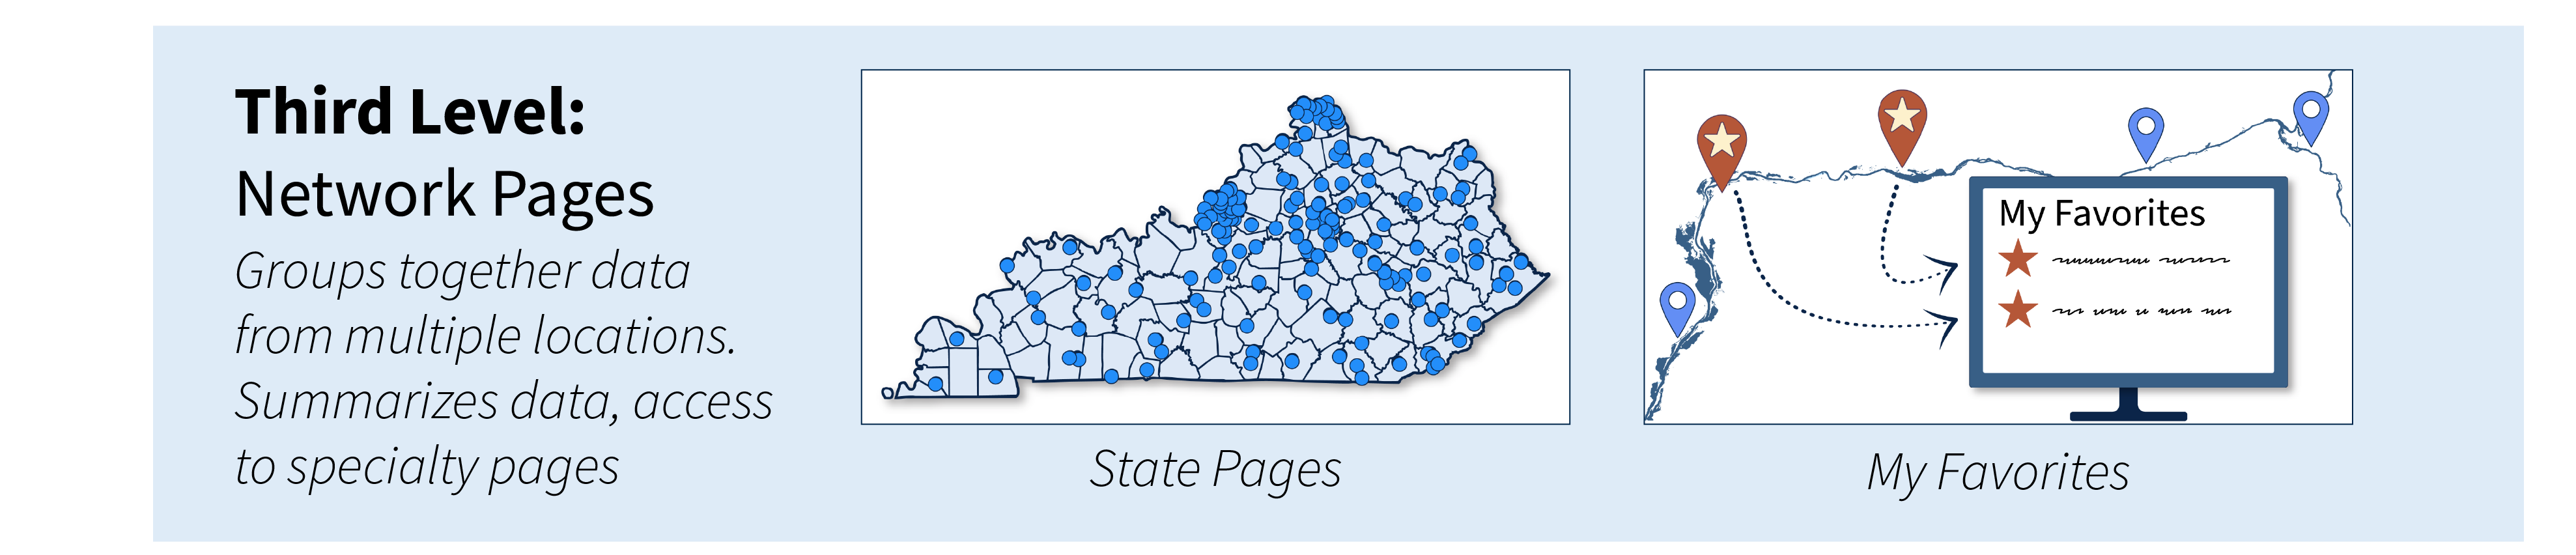
Network Pages: Group together data from multiple locations including the State Pages (accessible through the WDFN homepage at https://waterdata.usgs.gov/ ) and My Favorites at https://waterdata.usgs.gov/favorites/ .
We currently have two types of network pages:
- State Pages: On the State Pages, users can explore what data types are collected at each location or see locations that collect data types of interest by filtering the map and list. Access the State Pages through WDFN Home . Read more about the page on our previous blog post .
- My Favorites : The My Favorites page allows users to create a custom list of monitoring locations that can be bookmarked and shared for repeated viewings of key locations. Read more about the features on our previous blog post . My Favorites is also the place where you can view any number of data graphs from all your favorite locations on a single page.
Specialty Pages
Our largest category of WDFN pages is the Specialty Pages. Each of these pages meets a unique need for accessing water data that serve distinct users. We include ways to view data, ways to download or get sent our data, as well as descriptions of data services available from USGS Water Mission Area.
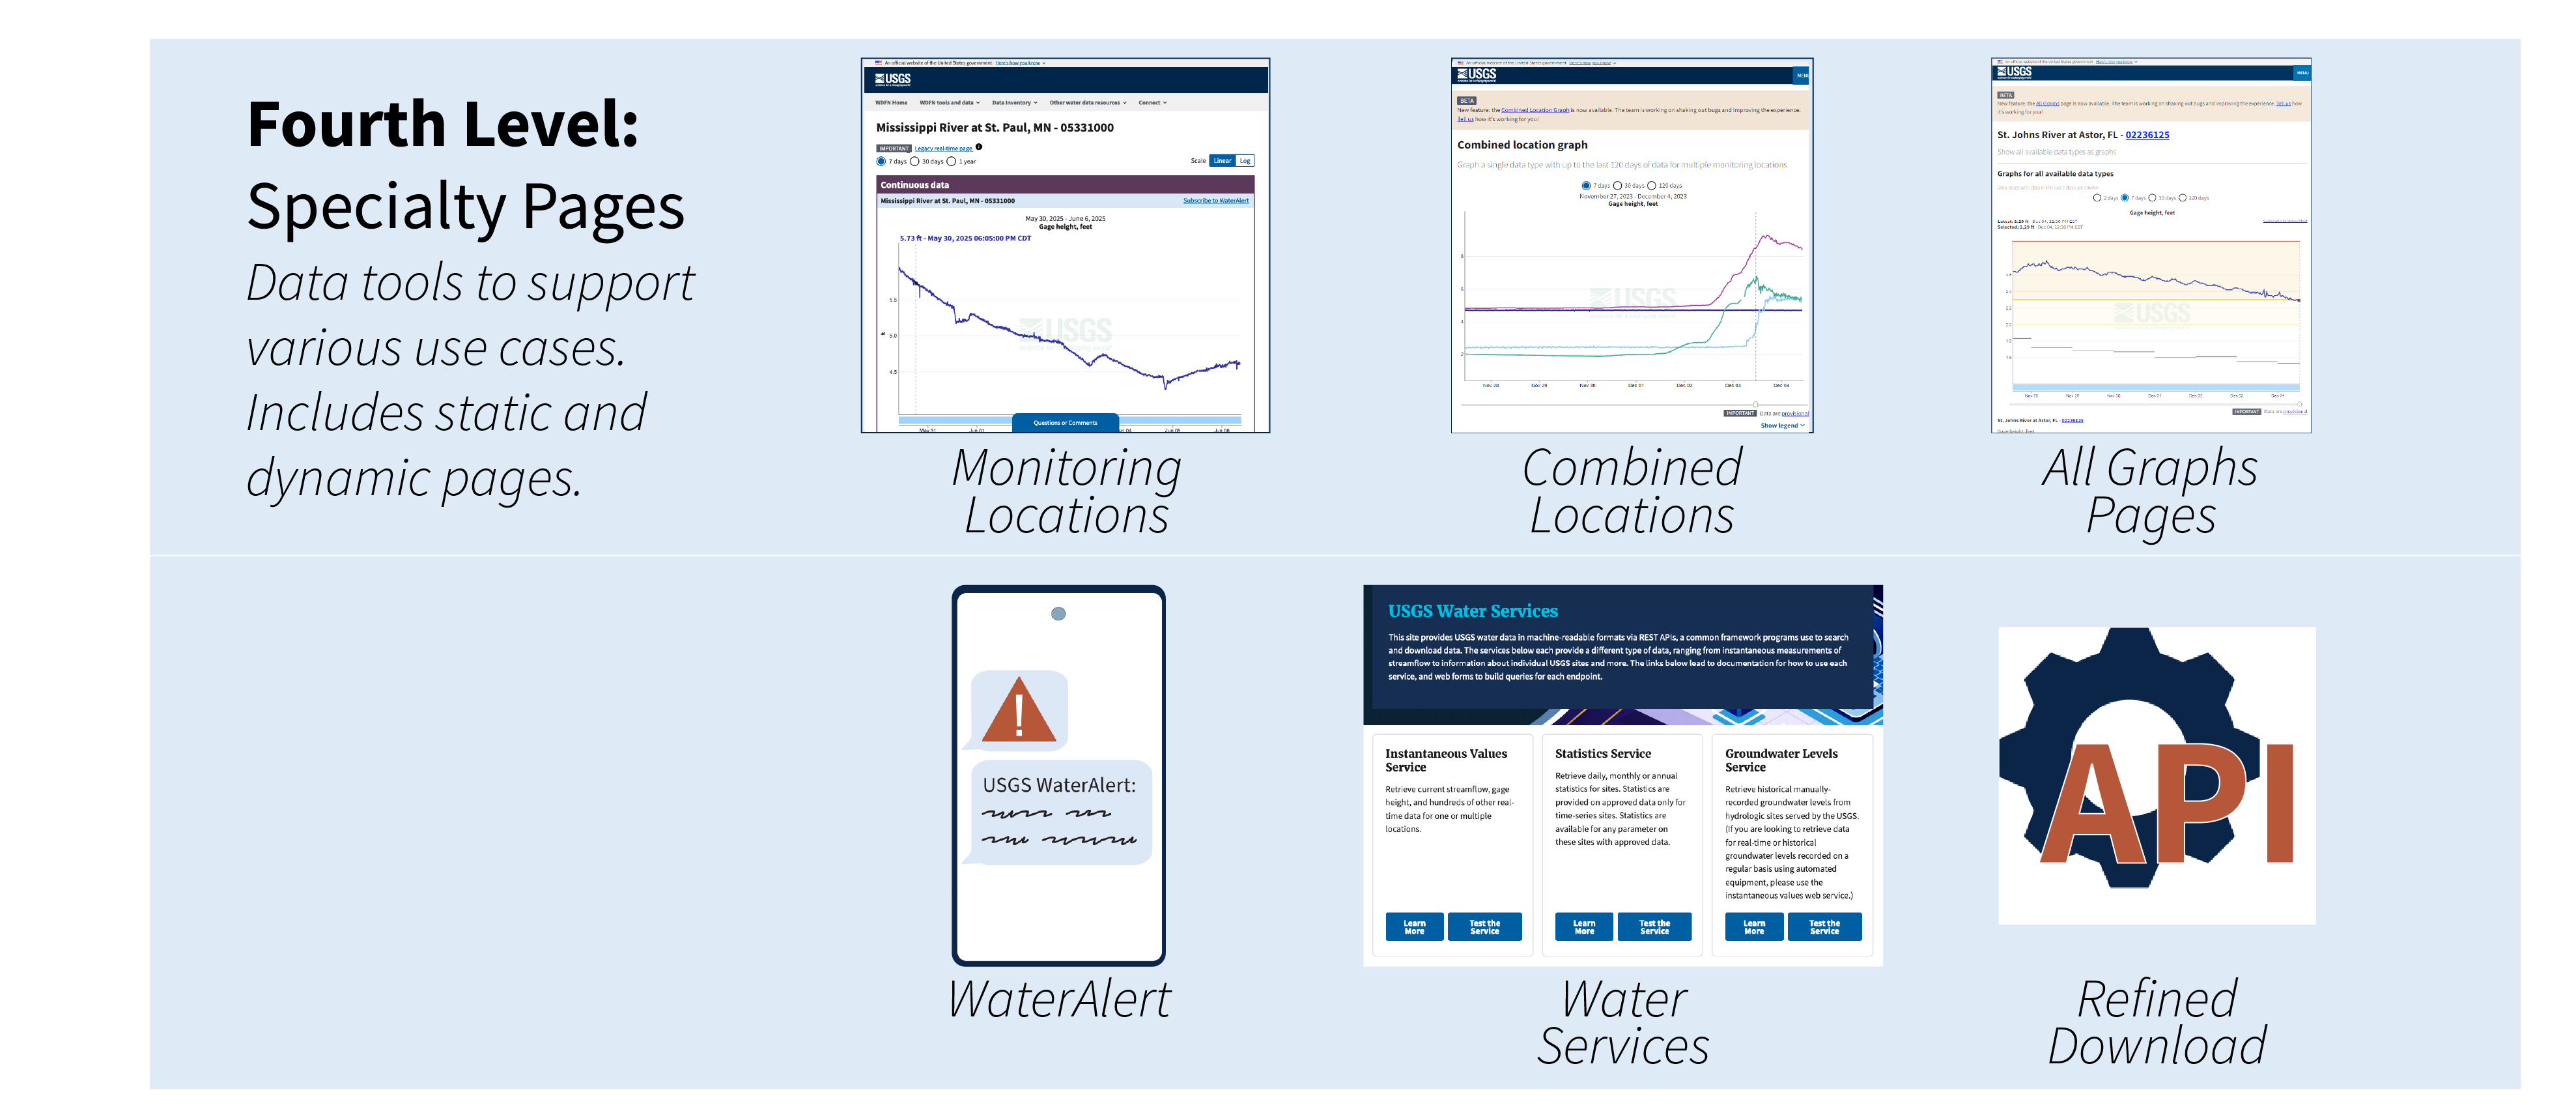
Specialty Pages: Data tools to support various use cases. These include three different ways to look at monitoring locations, such as on individuual Monitoring Location Pages, and the All Graphs page. The Speciality pages also include WaterAlert, Water Services, and the Refined Download (API) features.
We have 6 distinct Specialty Pages:
- Monitoring Location Page : All the information you need about any place we collect data. This page offers site metadata, such as location and funding information, and access to data summaries. This page also offers an interactive hydrograph that allows users to look at up to two types of data on one graph for a custom date period. Learn more about the Monitoringn Location Page modernization on our previous blog post
- Combined Location Graph : A new tool to look at data from multiple monitoring locations all in one image. Users specify the type of data they want to see and can compare it to that same data type at four other locations. Learn more on our previous blog post
- All graphs view of Monitoring Location Page : A new tool to see all the most recent data available for one monitoring location, displayed on a long-format webpage. This page allows users to look at all the data we’re monitoring with sensors, with each on its own graph so you can review the most recent conditions and status of a location at a glance without clicking. Read more on our previous blog post
- WaterAlert : Allows users to subscribe to alerts when water conditions change based on custom thresholds. Get notified with WaterAlert, a near-real time hydrologic alerting system that notifies you of stream, lake, and coastal conditions across the nation. Subscribe to text or email alerts when water conditions change. Read more on our previous blog post
- USGS Water Services : We recently updated the Water Services user interface, but are otherwise phasing out this main Water Services page. We are releasing new, modernized API endpoints throughout rest of 2025 which will provide the same data that you’re used to but with a new API interface and response format (see the next bullet)
- Refine Download/API Services : This is the new central hub for all modernized USGS water data APIs. There you will see links to a number of different endpoints, including for other USGS data like the National Imagery Management Service. You’ll also find a “documentation” tab which provides a central place for long-form API documentation. Finally, you’ll find a signup form for API keys. We’ll be updating this website to add more documentation and guides for using the new APIs. Read more about WDFN APIs in our previous blog post
What’s next?
Our team is busy working on the new tools and features for WDFN. As new features become available, a blog will be posted on the Water Data for the Nation Blog announcing key features. Informational banners will also announce the new features on WDFN pages with helpful links to where you can find them. Our team prioritizes upcoming work based on a mix of website analytics, user testing, and user feedback using our user-centered design processes . If you want to participate in our testing for WDFN, send an email to wdfn_usabilitytesting@usgs.gov with details on how you use USGS water data right now and how you are interested in participating.
Please subscribe to the Water Data for the Nation newsletter to receive updates about changes to water data APIs and other modernization efforts.
Categories:
Related Posts
Decommissioning Legacy gwlevels and SensorThings APIs – Fall 2025
September 23, 2025
Background
For over 15 years, the USGS has provided machine-readable and automated access to water data via the WaterServices family of application programming interfaces (APIs), which are hosted at https://waterservices.usgs.gov/ . These APIs underpin all other USGS web delivery products – including products such as the National Water Dashboard and Water Data for the Nation (WDFN) – and have been incredibly effective at delivering water data to the public. Between October 2024 and March 2025 alone, these legacy APIs have handled more than 1.6 billion requests from almost 3.5 million distinct IP addresses.
Modernization of Statistical Delivery and WaterWatch Decommission
June 10, 2025
USGS is modernizing how statistical information is delivered through a suite of new features and products. These are replacing WaterWatch , which offered unique statistics delivery that differentiated it from the core data delivery through legacy NWISWeb. WaterWatch and Water Quality Watch are set to be decommissioned by the end of 2025 as new products become available. This blog details where you can find the statistics previously offered on WaterWatch.
Big changes to USGS Water Data in 2025
May 28, 2025
Public USGS Webinar: Water Data for the Nation – New Features and NWISWeb Decommissioning
In this webinar, we highlight important changes in how we deliver water data. These changes are part of a long-term effort to modernize our Water Data for the Nation (WDFN) systems, improve performance, and better serve both internal and public users.
Modernized access for USGS rating curves is now available
April 28, 2026
Modernized access for USGS rating curves is now available
The USGS publishes rating curves describing the relationship between stage and streamflow at a monitoring location. Historically, these curves have been published at the NWISWeb Ratings Depot, available at https://waterdata.usgs.gov/nwisweb/get_ratings .
Metadata in Water Data for the Nation
December 29, 2025
Introduction
Metadata are crucial to interpreting and understanding USGS water data. Metadata are data that provides information about other data. They provide important context to the water data you are viewing on WDFN pages or downloading from USGS Water Data APIs . USGS water data metadata includes codes and abbreviations, such as parameter codes, method codes, and observed properties.