
How Web Flags help the public understand our data
Water data can be masked to help explain gaps in water data availability.
How Web Flags help the public understand our data
USGS Water Data are important to the public and help people to make critical decisions, but conditions in the field are often complicated to convey. Therefore, USGS hydrologic technicians apply web flags to convey gaps in data to the public so users understand unusual values or missing data.
Web flags are displayed graphically on monitoring location pages and can either be kept on data permanently or removed when data are reviewed and corrected. Here are some common web flags and some example reasons for their application. This list is not comprehensive and therefore does not include all possible web flags or all possible causes.
Web Flags Indicate Why No Data are Present
Discontinued
Definition
A station has been permanently or temporarily discontinued.
Example Causes
- A study has ended and data no longer needs to be collected at that site
- Funding has been discontinued
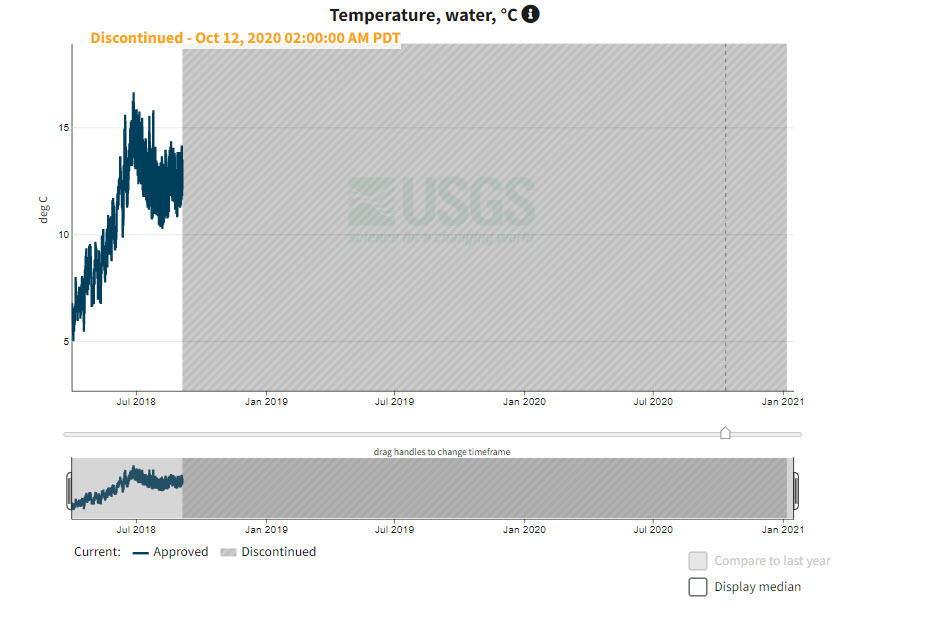
A hydrograph of temperature at site 13343000, where temperature data has been discontinued and is no longer served at this site.
Temporarily Unavailable
Definition
Data are not available and are not being transmitted for a short period of time, which can vary from hours to months, depending on site access.
Example Causes
- Transmission issues with telemetry equipment
- Issues with our data processing software
Seasonal
Definition
One or more types of data are not available because the station is in its off season, but data will be back in a matter of months.
Example Causes
- Weather conditions may damage sensors (e.g., due to ice chunks in the river)
- Accessibility changes that fluctuate with seasonal changes such as
- Lack of water flow
- Limited access to equipment
- Lack of ability to telemeter data
Web Flags Tell Users to be Cautious With Data
Equipment Malfunction
Definition
We suspect or have evidence that there is an equipment malfunction.
Example Causes
- Our monitoring equipment malfunctions, leading to inaccurate data
- Our monitoring equipment has been damaged
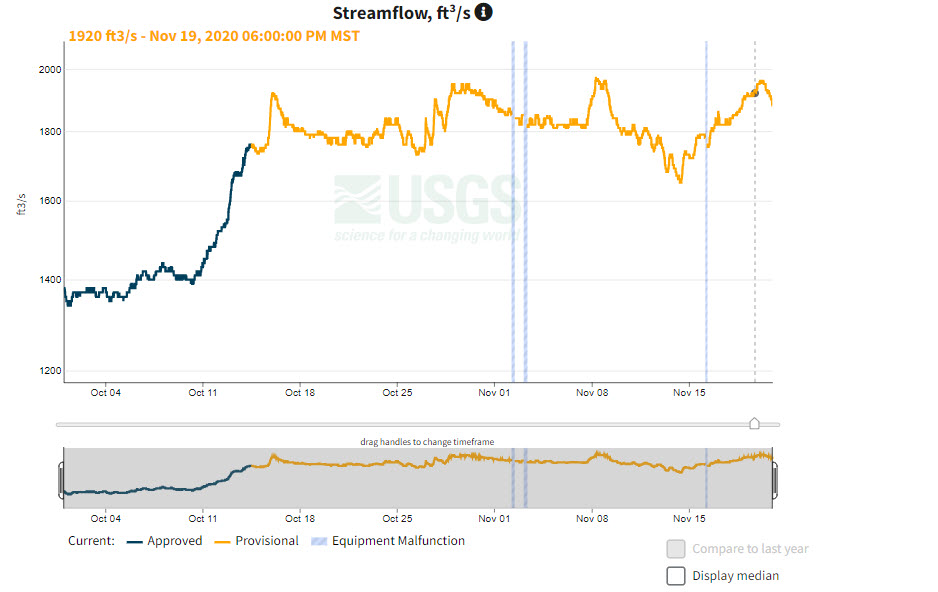
A hydrograph at location 13307000 where web flags were applied during periods of malfunctioning equipment in November 2020.
Backwater
Definition
Water that is backed up as compared with its normal or natural condition of flow. In stream gaging, a rise in stage is produced by a temporary obstruction. The difference between the observed stage and the one indicated by the stage-discharge relation is reported as backwater. Using the “Backwater” web flag allows users to see gage height data, but not discharge data as these data need to be corrected.
Example Causes
- Obstructions, such as beaver dams, weeds, or vegetation
- Ice jam in a stream channel
- Flooding downstream of the stream gage
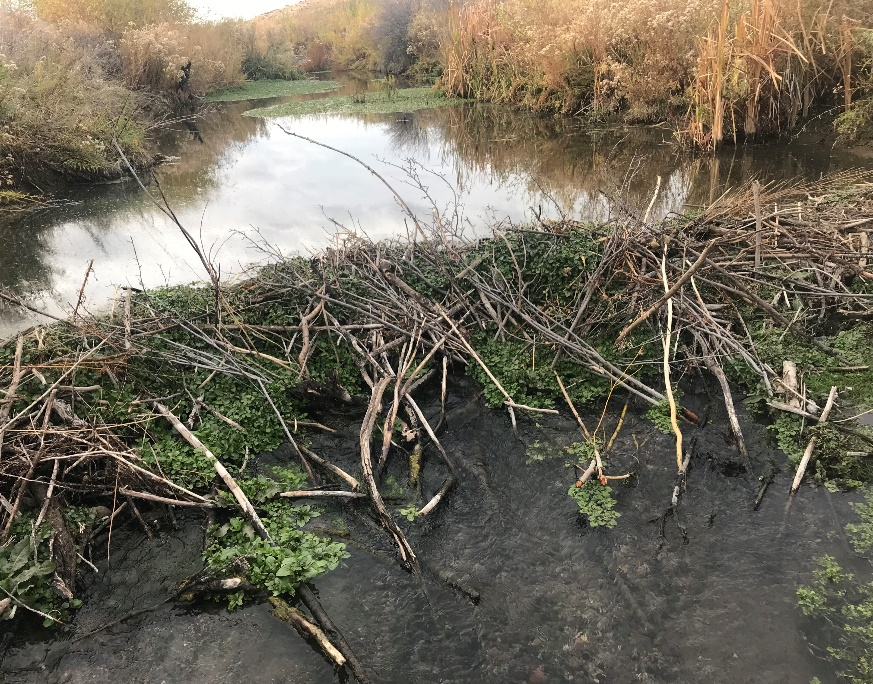
Photo of a stream affected by backwater. Photo credit, USGS-Scott Sylvester
Ice-Affected
Definition
Data are not being accurately transmitted due to the presence of ice.
Example Causes
- In cold climates, streams are commonly affected by ice, which can
- Inaccurately show more or less water than is actually there
- Block sensors
- Create backwater
- Otherwise prevent data from being transmitted accurately
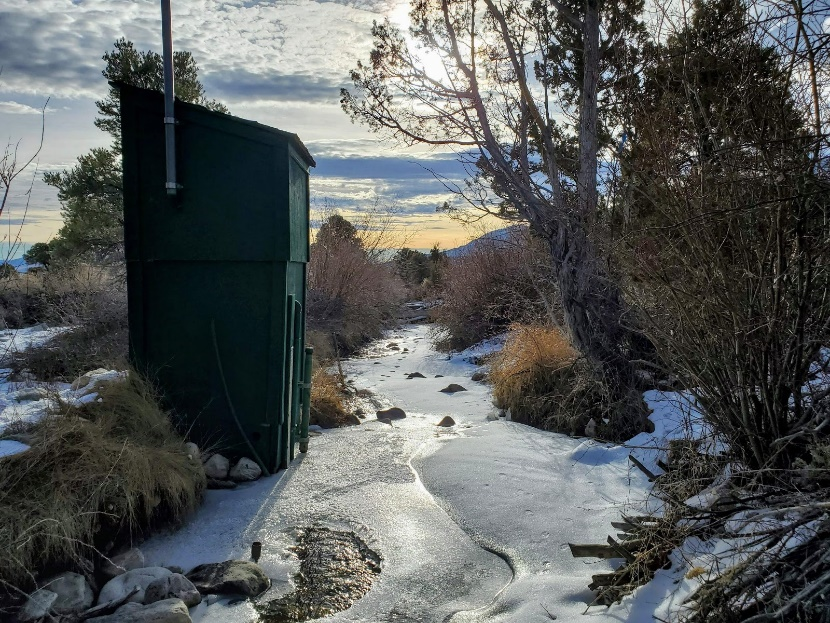
Photo of a stream whose data readings are affected by the presence of ice. This is when the ‘Ice Affected’ web flag would be used. Photo credit USGS-Austin Bove.
Maintenance
Definition
Maintenance is planned and/ or being conducted to stream monitoring equipment by our field hydrologic technicians.
Example Causes
Monitoring equipment
- Is damaged and needs to be repaired
- Requires routine maintenance
- Is currently undergoing maintenance
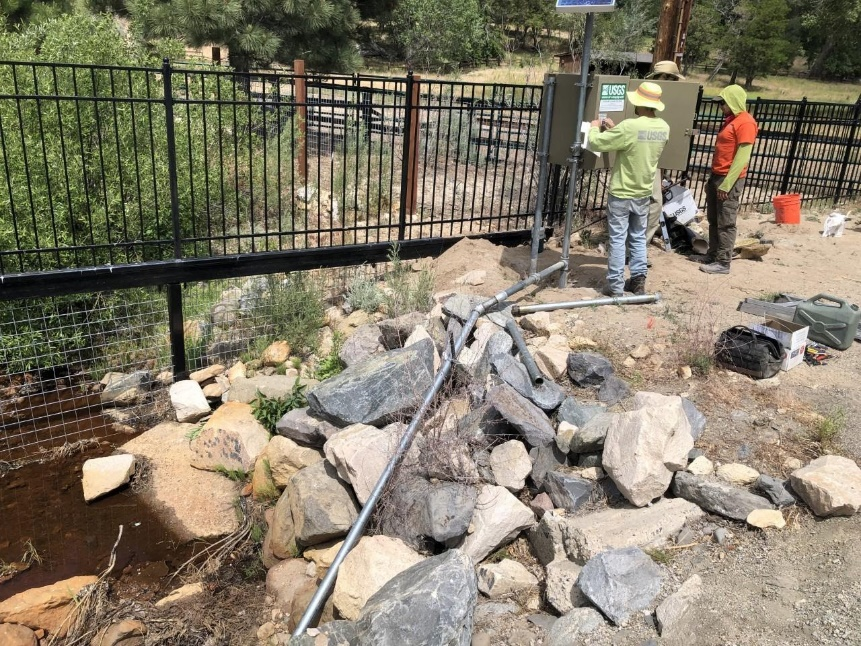
Two USGS staff repair equipment at an active streamgage. No data will be transmitted during this activity and a web flag can be applied to data during this time period. Photo credit: USGS - Cory Rogaczewski.
This is not a comprehensive list of all web flags that may be applied, but these examples show how web flags help us to explain to users what is happening with our data. Users can quickly glance at hydrographs with web flags and understand why data may not be showing up, what current conditions are, and how reliable we believe current data to be. Data transparency is fundamental to our mission at USGS.
Categories:
Related Posts
Daily data in Water Data for the Nation
November 21, 2025
There have been a lot of changes to how you access USGS water data as we work to modernize data delivery in WDFN and decommission NWISWeb. As we centralize and re-organize data delivery in WDFN, we have recently set out to describe different types of water data according to data collection categories . We started with re-organizing and expanding the data collection categories that are delivered on the Monitoring Location Page and are now working to deliver additional data collection categories on other WDFN pages as well. This blog is part of a series to help orient you to where you can find different types of data in WDFN pages and services. In this post, we want to focus on how you can access daily data in WDFN.
New Feature - Field Measurements
September 23, 2025
We are excited to announce a new feature on Monitoring Location pages that provide field measurements, which are physically measured values collected during a field visit to a monitoring location.
Data Graphs in Water Data for the Nation
September 16, 2025
This blog has been recently updated!
In 2025, we refreshed this blog to describe the graphing features that have come out in the WDFN ecosystem since 2023.
Modernization of Statistical Delivery and WaterWatch Decommission
June 10, 2025
USGS is modernizing how statistical information is delivered through a suite of new features and products. These are replacing WaterWatch , which offered unique statistics delivery that differentiated it from the core data delivery through legacy NWISWeb. WaterWatch and Water Quality Watch are set to be decommissioned by the end of 2025 as new products become available. This blog details where you can find the statistics previously offered on WaterWatch.
Big changes to USGS Water Data in 2025
May 28, 2025
Public USGS Webinar: Water Data for the Nation – New Features and NWISWeb Decommissioning
In this webinar, we highlight important changes in how we deliver water data. These changes are part of a long-term effort to modernize our Water Data for the Nation (WDFN) systems, improve performance, and better serve both internal and public users.