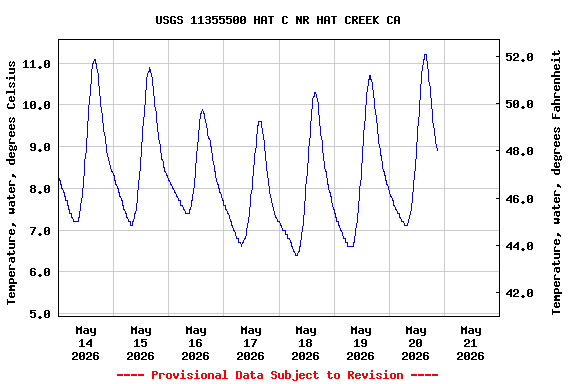
Most recent instantaneous value: 8.9 05-20-2026 21:00 PDT
See this graph on the Monitoring Location Pages
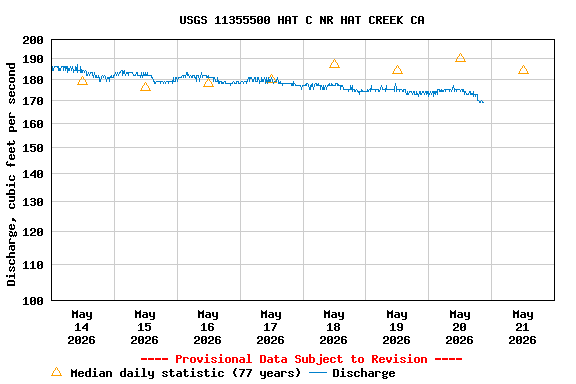
| Min (1933) | 25th percen- tile | Most Recent Instantaneous Value May 21 | Median | Mean | 75th percen- tile | Max (1958) |
|---|---|---|---|---|---|---|
| 88.0 | 151 | 169 | 184 | 186 | 215 | 331 |
![]() U.S. Department of the Interior |
U.S. Geological Survey
U.S. Department of the Interior |
U.S. Geological Survey
Title: USGS Current Conditions for California
URL:
Page Contact Information: California Water Data Support Team
Page Last Modified: 2026-05-21 01:07:21 EDT
4.98 4.07 vaww02