USGS 11481500 REDWOOD C NR BLUE LAKE CA

PROVISIONAL DATA SUBJECT TO REVISION

Click to hidestation-specific text
> Rating Information
This station managed by the Redding Field Office.

Available Parameters Available Period
  
1992-10-01  2024-04-23
2007-10-01  2024-04-23
2021-04-24  2024-04-23


 (7)
 

  -- or --


Summary of all available data for this site
Instantaneous-data availability statement
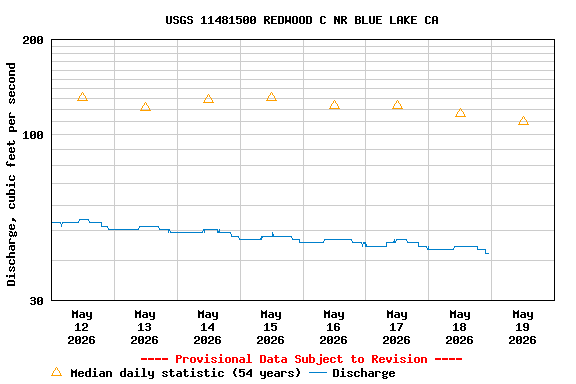

Discharge, cubic feet per second

Most recent instantaneous value: 155 04-23-2024   07:45 PDT
Graph of  Discharge, cubic feet per second

Add up to 2 more sites and replot for "Discharge, cubic feet per second"

?


Create presentation-quality / stand-alone graph.   Subscribe to WaterAlert      

See this graph on the Monitoring Location Pages


Daily discharge, cubic feet per second -- statistics for Apr 23 based on 52 water years of record more
Min
(1977)
25th
percen-
tile
Most Recent
Instantaneous
Value Apr 23
Median Mean 75th
percen-
tile
Max
(1983)
57.0 148 155 242 263 337 668


Gage height, feet

Most recent instantaneous value: 2.12 04-23-2024   07:45 PDT
Graph of  Gage height, feet

Add up to 2 more sites and replot for "Gage height, feet"

?


Create presentation-quality / stand-alone graph.   Subscribe to WaterAlert      

See this graph on the Monitoring Location Pages


Stream water level elevation above NAVD 1988, in feet

Most recent instantaneous value: 869.38 04-23-2024   07:45 PDT
Graph of  Stream water level elevation above NAVD 1988, in feet

Add up to 2 more sites and replot for "Stream water level elevation above NAVD 1988, in feet"

?


Create presentation-quality / stand-alone graph.   Subscribe to WaterAlert      

See this graph on the Monitoring Location Pages