USGS 07119700 ARKANSAS RIVER AT CATLIN DAM, NEAR FOWLER, CO.

PROVISIONAL DATA SUBJECT TO REVISION
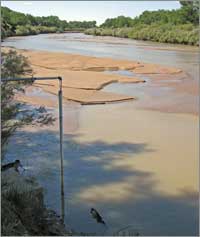
Click to hidestation-specific text
Click for larger image

This streamflow gaging station currently is operated by the Colorado Division of Water Resources (DWR). The USGS works cooperatively with the DWR to publish daily mean (and annual peak) discharge data for this station. These are the only streamflow data available in NWISWeb for this site. The daily mean discharge values for this site are determined by summation of the daily mean discharges for two DWR sites,
Arkansas River at Catlin Dam near Fowler (ARKCATCO) and
Catlin Canal at Catlin Dam near Fowler (CATCANCO).
Current streamflow data (and other historical streamflow data) for these sites are available on the DWR Colorado's Surface Water Conditions pages, at the two links above.

Water temperature and specific conductance monitors at this station are operated by the U.S. Geological Survey in cooperation with Southeastern Colorado Water Conservancy District.

This station managed by the Pueblo Southeast Colorado Office.

Available Parameters Available Period
  
2007-10-01  2024-11-23
2007-10-01  2024-11-23


 (7)
 

  -- or --


Summary of all available data for this site
Instantaneous-data availability statement


Temperature, water, degrees Celsius

Most recent instantaneous value: 6.2 11-23-2024   00:15 MST
Graph of  Temperature, water, degrees Celsius

Add up to 2 more sites and replot for "Temperature, water, degrees Celsius"

?


Create presentation-quality / stand-alone graph.   Subscribe to WaterAlert      

See this graph on the Monitoring Location Pages


Specific conductance, water, unfiltered, microsiemens per centimeter at 25 degrees Celsius

Most recent instantaneous value: 1170 11-23-2024   00:15 MST
Graph of  Specific conductance, water, unfiltered, microsiemens per centimeter at 25 degrees Celsius

Add up to 2 more sites and replot for "Specific conductance, water, unfiltered, microsiemens per centimeter at 25 degrees Celsius"

?


Create presentation-quality / stand-alone graph.   Subscribe to WaterAlert      

See this graph on the Monitoring Location Pages