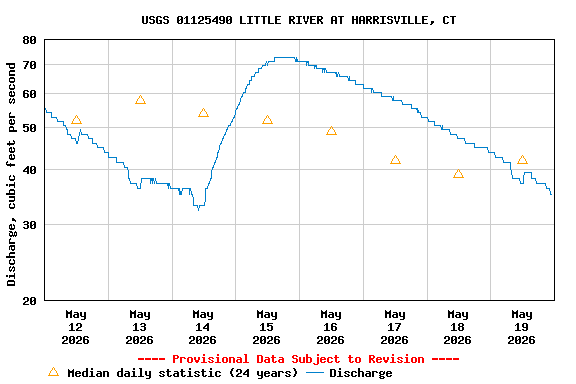
USGS 01125490 LITTLE RIVER AT HARRISVILLE, CT

PROVISIONAL DATA SUBJECT TO REVISION

Available Parameters Available Period
  
2011-06-10  2025-07-14
2011-06-09  2025-07-14


 (7)
 

  -- or --


Summary of all available data for this site
Instantaneous-data availability statement


Discharge, cubic feet per second

Most recent instantaneous value: 74.9 07-14-2025   02:45 EDT
Graph of  Discharge, cubic feet per second

Add up to 2 more sites and replot for "Discharge, cubic feet per second"

?


Create presentation-quality / stand-alone graph.   Subscribe to WaterAlert      

See this graph on the Monitoring Location Pages


Daily discharge, cubic feet per second -- statistics for Jul 14 based on 24 water years of record more
Min
(1965)
25th
percen-
tile
Median 75th
percen-
tile
Mean Most Recent
Instantaneous
Value Jul 14
Max
(2021)
0.90 7.4 10 19 38 74.9 366


Gage height, feet

Most recent instantaneous value: 2.12 07-14-2025   02:45 EDT
Graph of  Gage height, feet

Add up to 2 more sites and replot for "Gage height, feet"

?


Create presentation-quality / stand-alone graph.   Subscribe to WaterAlert      

See this graph on the Monitoring Location Pages