Warning: Javascript must be enabled to use all the features on this page!


Page Loading - Please Wait...

* We've detected you're using a mobile device. Find our Next Generation Station Page here.
Click to hideNews Bulletins
Click to hide state-specific text


USGS 02319302 MADISON BLUE SPRING NR BLUE SPRINGS, FL

PROVISIONAL DATA SUBJECT TO REVISION

Click to hidestation-specific text

This gage is monitored in cooperation with the Suwannee River Water Management District.

Link to the Suwannee River Water Management District

REMARKS.--Computed discharge at this station may differ from individual measurements because of changes in tidal influence, wind, or other factors. At stages below 9.00 ft discharge computed from relation between artesian pressure at Blue Springs well near Madison, FL (302847083145401), provided by Suwannee River Water Management District. At stages above 9.00 ft a differential head rating is used, using Blue Springs well near Madison, FL (302847083145401) and the stage at the site. During periods of high water, the spring is affected by variable backwater from the Withlacoochee River, which at times, can result in negative flow back into the spring vent. Prior to Oct. 7, 2011, discharge was computed using different methods.
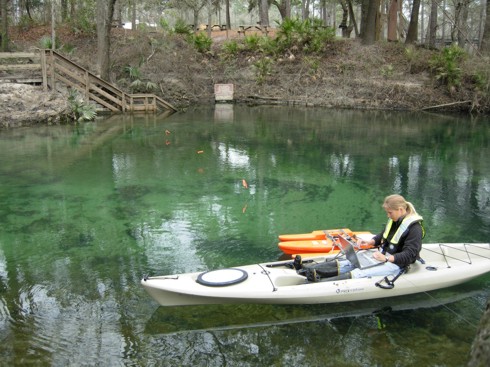

March 9, 2010

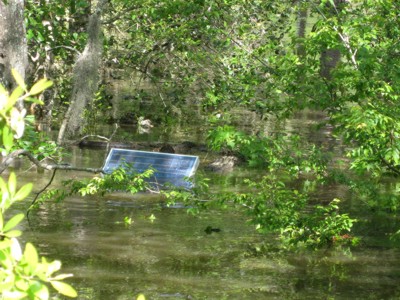
Flooding conditions on April 7, 2009.
During periods of higher water levels the Withlacoochee River backs up into the spring run. The water quality data collected during these periods is not representative of water coming from the spring, but the Withlacoochee River.
Available Parameters Period of Record
  
2014-07-09  2024-04-18
2017-01-09  2024-04-18
2002-04-13  2024-04-18
2014-07-09  2024-04-18
2014-07-09  2024-04-18
2014-07-09  2024-04-18
2014-10-01  2024-04-18
2014-07-09  2024-04-18


 (365)
 

  -- or --


Summary of all available data for this site
Instantaneous-data availability statement


Discharge, cubic feet per second


Graph of DAILY Discharge, cubic feet per second

Add up to 2 more sites and replot for "Discharge, cubic feet per second"

?


Create presentation-quality graph.  


Gage height, feet


Graph of DAILY Gage height, feet

Add up to 2 more sites and replot for "Gage height, feet"

?


Create presentation-quality graph.