USGS 02317620 ALAPAHA RIVER NEAR JENNINGS FLA

PROVISIONAL DATA SUBJECT TO REVISION

Click to hidestation-specific text

This gage is monitored in cooperation with the Suwannee River Water Management District.

Link to the Suwannee River Water Management District


Low water on August 17, 2007.

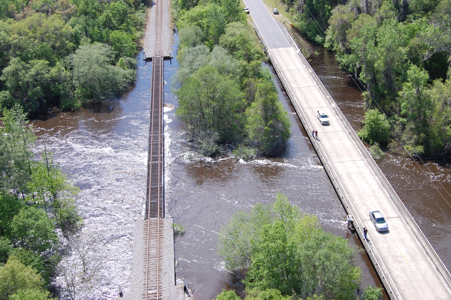
High water on April 15, 2009.
Available Parameters Available Period
  
2017-01-17  2026-01-20
1986-10-01  2026-01-20
2007-10-01  2026-01-20
2017-01-17  2026-01-20


 (7)
 

  -- or --


Summary of all available data for this site
Instantaneous-data availability statement


Temperature, water, degrees Celsius

Most recent instantaneous value: 8.6 01-20-2026   03:00 EST
Graph of  Temperature, water, degrees Celsius

Add up to 2 more sites and replot for "Temperature, water, degrees Celsius"

?


Create presentation-quality / stand-alone graph.   Subscribe to WaterAlert      

See this graph on the Monitoring Location Pages


Discharge, cubic feet per second

Most recent instantaneous value: 200 01-20-2026   03:00 EST
Graph of  Discharge, cubic feet per second

Add up to 2 more sites and replot for "Discharge, cubic feet per second"

?


Create presentation-quality / stand-alone graph.   Subscribe to WaterAlert      

See this graph on the Monitoring Location Pages


Daily discharge, cubic feet per second -- statistics for Jan 20 based on 30 water years of record more
Min
(2000)
Most Recent
Instantaneous
Value Jan 20
25th
percen-
tile
Median Mean 75th
percen-
tile
Max
(1987)
104 200 589 1910 1970 3100 7470


Gage height, feet

Most recent instantaneous value: 62.37 01-20-2026   03:00 EST
Graph of  Gage height, feet

Add up to 2 more sites and replot for "Gage height, feet"

?


Create presentation-quality / stand-alone graph.   Subscribe to WaterAlert      

See this graph on the Monitoring Location Pages


Specific conductance, water, unfiltered, microsiemens per centimeter at 25 degrees Celsius

Most recent instantaneous value: 137 01-20-2026   03:00 EST
Graph of  Specific conductance, water, unfiltered, microsiemens per centimeter at 25 degrees Celsius

Add up to 2 more sites and replot for "Specific conductance, water, unfiltered, microsiemens per centimeter at 25 degrees Celsius"

?


Create presentation-quality / stand-alone graph.   Subscribe to WaterAlert      

See this graph on the Monitoring Location Pages