USGS 02322700 ICHETUCKNEE R @ HWY27 NR HILDRETH, FL

PROVISIONAL DATA SUBJECT TO REVISION

Click to hidestation-specific text

This gage is monitored in cooperation with the Florida Department of Environmental Protection.

Link to the Florida Department of Environmental Protection.


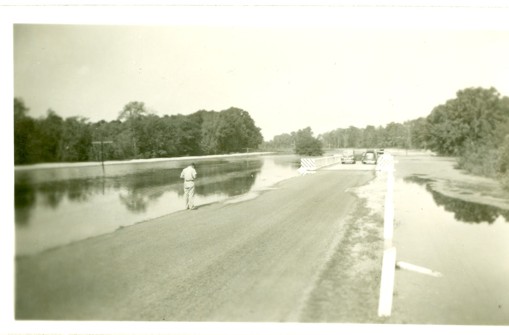
High water on April 10, 1948.

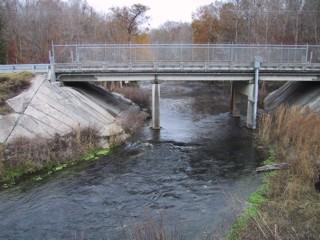
Gage structure on January 3, 2002.
Available Parameters Available Period
  
2017-01-18  2023-06-03
2002-02-05  2023-06-03
2007-10-01  2023-06-03
2017-01-18  2023-06-03
2022-01-20  2023-06-03
2022-01-20  2023-06-03
2023-02-06  2023-06-03
2016-11-15  2023-06-03


 (7)
 

  -- or --


Summary of all available data for this site
Instantaneous-data availability statement


Discharge, cubic feet per second

Most recent instantaneous value: 284 06-03-2023   20:45 EDT
Graph of  Discharge, cubic feet per second

Add up to 2 more sites and replot for "Discharge, cubic feet per second"

?


Create presentation-quality / stand-alone graph.   Subscribe to WaterAlert      

See this graph on the Monitoring Location Pages


Daily discharge, cubic feet per second -- statistics for Jun 3 based on 20 water years of record more
Min
(2002)
25th
percen-
tile
Most Recent
Instantaneous
Value Jun 3
Median Mean 75th
percen-
tile
Max
(2005)
194 271 284 291 300 323 518


Gage height, feet

Most recent instantaneous value: 15.08 06-03-2023   20:45 EDT
Graph of  Gage height, feet

Add up to 2 more sites and replot for "Gage height, feet"

?


Create presentation-quality / stand-alone graph.   Subscribe to WaterAlert      

See this graph on the Monitoring Location Pages


Mean water velocity for discharge computation, feet per second

Most recent instantaneous value: 2.91 06-03-2023   20:45 EDT
Graph of  Mean water velocity for discharge computation, feet per second

Add up to 2 more sites and replot for "Mean water velocity for discharge computation, feet per second"

?


Create presentation-quality / stand-alone graph.   Subscribe to WaterAlert      

See this graph on the Monitoring Location Pages