USGS 02327100 SOPCHOPPY RIVER NR SOPCHOPPY, FLA.

PROVISIONAL DATA SUBJECT TO REVISION

Click to hidestation-specific text

This gage is monitored as part of the National Groundwater and Streamflow Information Program.

Link to the National Groundwater and Streamflow Information Program


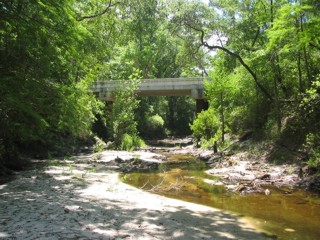
Looking downstream-June 8, 2007.

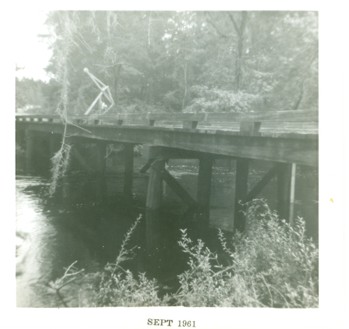
High flow measurement-September 1961.
Available Parameters Available Period
  
2018-01-31  2025-11-19
1986-10-01  2026-05-31
2007-10-01  2026-05-31


 (7)
 

  -- or --


Summary of all available data for this site
Instantaneous-data availability statement

Temperature, water, degrees Celsius
 
-- Data temporarily unavailable for the time period specified --


Discharge, cubic feet per second

Most recent instantaneous value: 0.49 05-31-2026   08:30 EDT
Graph of  Discharge, cubic feet per second

Add up to 2 more sites and replot for "Discharge, cubic feet per second"

?


Create presentation-quality / stand-alone graph.   Subscribe to WaterAlert      

See this graph on the Monitoring Location Pages


Daily discharge, cubic feet per second -- statistics for May 31 based on 61 water years of record more
Most Recent
Instantaneous
Value May 31
Min
(2007)
25th
percen-
tile
Median 75th
percen-
tile
Mean Max
(2018)
0.49 1.20 2.5 6.3 50 96 1670


Gage height, feet

Most recent instantaneous value: 7.97 05-31-2026   08:30 EDT
Graph of  Gage height, feet

Add up to 2 more sites and replot for "Gage height, feet"

?


Create presentation-quality / stand-alone graph.   Subscribe to WaterAlert      

See this graph on the Monitoring Location Pages