USGS 02192500 LITTLE RIVER NEAR MT. CARMEL, SC

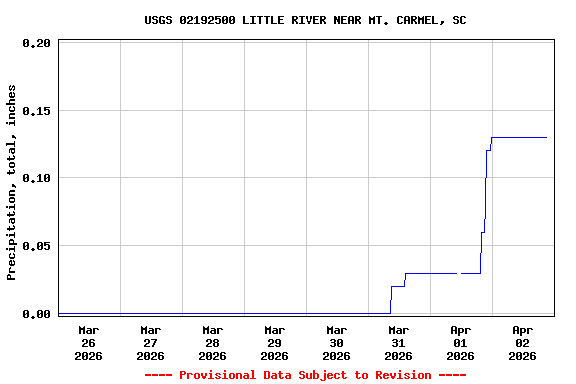
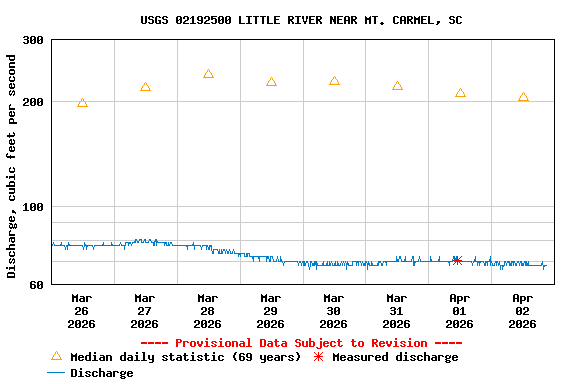
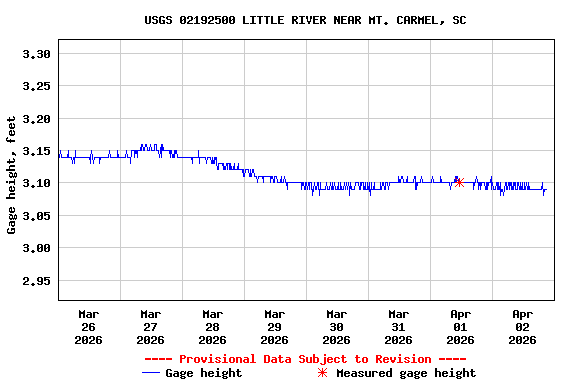
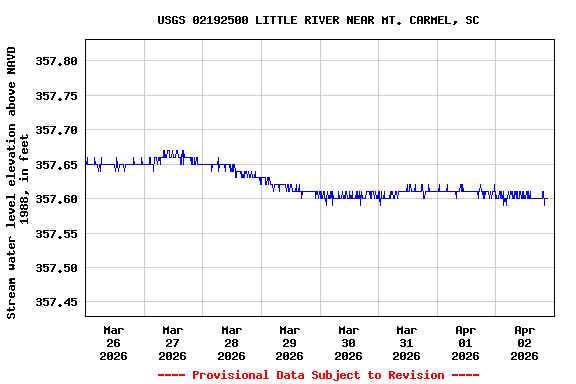
PROVISIONAL DATA SUBJECT TO REVISION

Click to hidestation-specific text
South Carolina DNR

This USGS monitoring station is funded in cooperation with the South Carolina Department of Natural Resources.


Little River near Mt.Carmel, SC - USGS file photo
Boating safety tips
This station managed by the South Atlantic WSC Columbia Field Office.

Available Parameters Available Period
  
2010-10-12  2026-04-01
1986-10-01  2026-04-01
2011-10-06  2026-04-01
2021-10-01  2026-04-01


 (7)
 

  -- or --


Summary of all available data for this site
Instantaneous-data availability statement


Precipitation, total, inches

Most recent instantaneous value: 0.00 04-01-2026   18:00 EDT
Graph of  Precipitation, total, inches

Add up to 2 more sites and replot for "Precipitation, total, inches"

?


Create presentation-quality / stand-alone graph.   Subscribe to WaterAlert      

See this graph on the Monitoring Location Pages


Discharge, cubic feet per second

Most recent instantaneous value: 70.0 04-01-2026   18:00 EDT
Graph of  Discharge, cubic feet per second

Add up to 2 more sites and replot for "Discharge, cubic feet per second"

?


Create presentation-quality / stand-alone graph.   Subscribe to WaterAlert      

See this graph on the Monitoring Location Pages


Daily discharge, cubic feet per second -- statistics for Apr 1 based on 69 water years of record more
Min
(2012)
Most Recent
Instantaneous
Value Apr 1
25th
percen-
tile
Median Mean 75th
percen-
tile
Max
(1961)
48.3 70.0 157 211 349 369 1940


Gage height, feet

Most recent instantaneous value: 3.10 04-01-2026   18:00 EDT
Graph of  Gage height, feet

Add up to 2 more sites and replot for "Gage height, feet"

?


Create presentation-quality / stand-alone graph.   Subscribe to WaterAlert      

See this graph on the Monitoring Location Pages


Stream water level elevation above NAVD 1988, in feet

Most recent instantaneous value: 357.61 04-01-2026   18:00 EDT
Graph of  Stream water level elevation above NAVD 1988, in feet

Add up to 2 more sites and replot for "Stream water level elevation above NAVD 1988, in feet"

?


Create presentation-quality / stand-alone graph.   Subscribe to WaterAlert      

See this graph on the Monitoring Location Pages