LOCATION.--Lat 42°44'24", long 91°15'42"
referenced to North American Datum of 1927, in SE 1/4 SE 1/4 NW 1/4
sec.36, T.92 N., R.4 W., Clayton County, IA, Hydrologic Unit
07060004, on right bank on downstream side of bridge on County
Highway C43, at southern edge of Garber, 800 ft upstream from Wayman
Creek, 2,000 ft downstream from Elk Creek, 1.0 mi downstream from
Volga River, and 21.2 mi upstream from mouth. (map)
DRAINAGE AREA.--1,545 mi2.
SURFACE-WATER RECORDS
PERIOD OF RECORD.--Discharge records from August 1913 to November
1916, May 1919 to September 1927, April 1929 to September 1930,
October 1932 to current year. Prior to December 1932, monthly mean
discharge for some periods published in WSP 1308.
REVISED RECORDS.--WSP 1308: 1922-25 (M), 1927 (M). WSP 1438:
Drainage area.
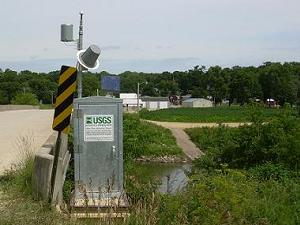
GAGE.--Water-stage recorder. Datum of gage is 634.46 ft above
National Geodetic Vertical Datum of 1929. Prior to February 7, 1935,
non-recording gage at same site and datum.
WATER-QUALITY RECORDS
PERIOD OF RECORD.--Water years 1958-1962, 2004 to current
year.
PERIOD OF DAILY RECORD.--
NITRATE + NITRITE: May 2012 to current year, records
fragmentary.
WATER TEMPERATURE: Daily instantaneous values collected in
conjunction with suspended-sediment samples, October 1957 to
September 1962, records fragmentary. Daily mean, May 2012 to current
year.
SUSPENDED-SEDIMENT CONCENTRATION AND DISCHARGE: October 1957 to
September 1962.
 Site Information