USGS 05464420 Cedar River at Blairs Ferry Road at Palo, IA

PROVISIONAL DATA SUBJECT TO REVISION

Click to hidestation-specific text
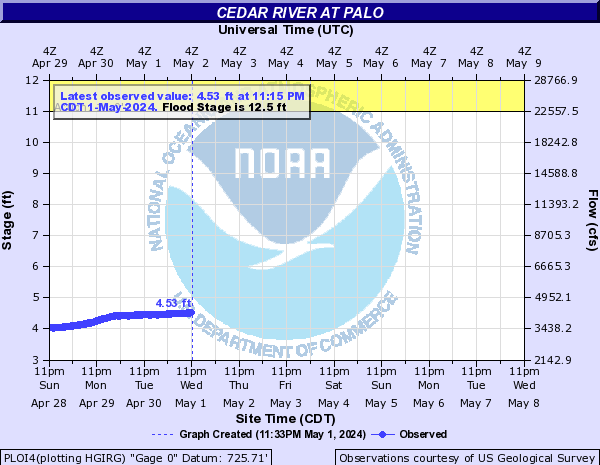
> Site Information

> Images

> National Weather Service River Forecast

Funding For This Site Provided By:

Link to Upstream Gage

Iowa WSC Gage Network

Link to Downstream Gage


This station managed by the Iowa City Field Office.

Available Parameters Available Period
  
2018-08-03  2023-12-13
2012-10-13  2018-08-03
2009-03-26  2024-03-19
2009-03-26  2024-03-19
2018-08-03  2023-12-13
2018-08-03  2023-12-13
2023-11-20  2023-12-13
2022-03-16  2023-12-13
2021-04-06  2023-12-13
2021-03-19  2024-03-19
2018-08-03  2023-12-13
2012-10-14  2024-03-19


 (7)
 

  -- or --


Summary of all available data for this site
Instantaneous-data availability statement


Discharge, cubic feet per second

Most recent instantaneous value: 816 03-19-2024   02:15 CDT
Graph of  Discharge, cubic feet per second

Add up to 2 more sites and replot for "Discharge, cubic feet per second"

?


Create presentation-quality / stand-alone graph.   Subscribe to WaterAlert      

See this graph on the Monitoring Location Pages


Daily discharge, cubic feet per second -- statistics for Mar 19 based on 14 water years of record more
Most Recent
Instantaneous
Value Mar 19
Min
(2012)
25th
percen-
tile
Median 75th
percen-
tile
Mean Max
(2019)
816 2630 4550 8110 11600 13800 60900


Gage height, feet

Most recent instantaneous value: 1.59 03-19-2024   02:15 CDT
Graph of  Gage height, feet

Add up to 2 more sites and replot for "Gage height, feet"

?


Create presentation-quality / stand-alone graph.   Subscribe to WaterAlert      

See this graph on the Monitoring Location Pages


Stream water level elevation above NGVD 1929, in feet

Most recent instantaneous value: 727.30 03-19-2024   02:15 CDT
Graph of  Stream water level elevation above NGVD 1929, in feet

Add up to 2 more sites and replot for "Stream water level elevation above NGVD 1929, in feet"

?


Create presentation-quality / stand-alone graph.   Subscribe to WaterAlert      

See this graph on the Monitoring Location Pages


Nitrate plus nitrite, water, in situ, milligrams per liter as nitrogen

Most recent instantaneous value: 1.54 03-19-2024   02:15 CDT
Graph of  Nitrate plus nitrite, water, in situ, milligrams per liter as nitrogen

Add up to 2 more sites and replot for "Nitrate plus nitrite, water, in situ, milligrams per liter as nitrogen"

?


Create presentation-quality / stand-alone graph.   Subscribe to WaterAlert      

See this graph on the Monitoring Location Pages