LOCATION.--Lat 41°36'45", long 93°37'15"
referenced to North American Datum of 1927, in SE 1/4 NE 1/4 NE 1/4
sec.34, T.79 N., R.24 W., Polk County, IA, Hydrologic Unit 07100004,
on right bank 5 ft upstream from bridge on State Highway 60 (2nd
Avenue) in Des Moines, 1.8 mi upstream from Center Street dam, 2.8 mi
upstream from Raccoon River, 4.5 mi downstream from Beaver Creek, and
195.9 mi upstream from mouth. (map)
DRAINAGE AREA.--6,245 mi2.
SURFACE-WATER RECORDS
PERIOD OF RECORD.--Gage heights and discharge measurements,
October 1902 to August 1903, October 1914 to February 1915; discharge
records from March 1915 to September 1961, October 1996 to current
year.
REVISED RECORDS.--WSP 1308: 1915-19, 1921, 1923, 1933, 1943 (M).
WSP 1438: Drainage area.
GAGE.--Water-stage recorder. Datum of gage is 773.74 ft above
National Geodetic Vertical Datum of 1929, and 0.10 ft below City of
Des Moines datum. October 2, 1902, to August 3, 1903, non-recording
gage at site 2.1 mi downstream at Walnut Street bridge at datum 0.10
ft higher; May 24, 1905, to July 20, 1906, non-recording gage at site
1.9 mi upstream at Interurban Trail bridge at datum 0.10 ft higher;
January 1912 to September 30, 1927, water-stage recorder at site 2.1
mi downstream at Walnut Street bridge at datum 0.10 ft higher;
October 1, 1932, to September 30, 1938, water-stage recorder at site
2.1 mi downstream at Walnut Street bridge at same datum; October 1,
1938, to August 29, 1939, non-recording gage at site 1.8 mi
downstream at Center Street dam at same datum (used as auxiliary gage
from February 13, 1934, to September 30, 1938); August 30, 1939, to
August 20, 1941, water-stage recorder at site 1.8 mi downstream at
Center Street dam at same datum.
REMARKS.--Flow regulated by Saylorville Lake (station 05481630),
6.8 mi upstream, since April 12, 1977.
WATER-QUALITY RECORDS
PERIOD OF RECORD.--Water years 1955-1961, 2008, 2012.
PERIOD OF DAILY RECORD.--
WATER TEMPERATURE: Daily instantaneous values collected in
conjunction with suspended-sediment samples, November 1954 to
September 1961.
SUSPENDED-SEDIMENT CONCENTRATION AND DISCHARGE: November 1954 to
September 1961.
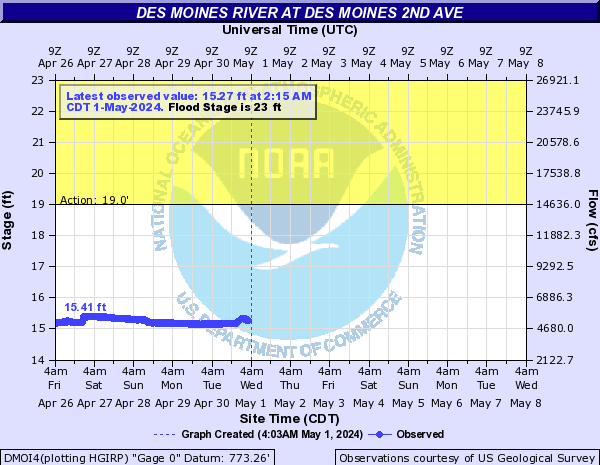
 National Weather Service River
Forecast
National Weather Service River
Forecast