USGS 13336500 SELWAY RIVER NR LOWELL ID

PROVISIONAL DATA SUBJECT TO REVISION

Click to hidestation-specific text


Selway River near Lowell, ID - USGS file photo Selway River near Lowell, ID - USGS file photo - high flows May 2008 Selway River near Lowell, ID - USGS file photo - hydrographer Russ Christensen measuring high flows May 2008

> Rating Information

> NWS River Forecasts

Station is operated in cooperation with the U.S. Army Corps of Engineers .
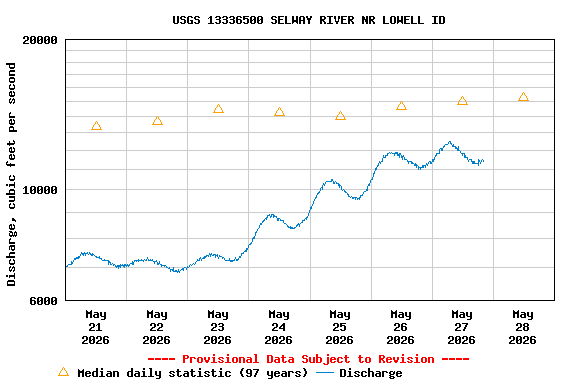
This station managed by the Post Falls Field Office.

Available Parameters Available Period
  
1986-10-01  2010-09-30
1986-10-01  2024-05-28
2007-10-01  2024-05-28


 (7)
 

  -- or --


Summary of all available data for this site
Instantaneous-data availability statement


Discharge, cubic feet per second

Most recent instantaneous value: 8690 05-28-2024   13:00 PDT
Graph of  Discharge, cubic feet per second

Add up to 2 more sites and replot for "Discharge, cubic feet per second"

?


Create presentation-quality / stand-alone graph.   Subscribe to WaterAlert      

See this graph on the Monitoring Location Pages


Daily discharge, cubic feet per second -- statistics for May 28 based on 95 water years of record more
Min
(1987)
Most Recent
Instantaneous
Value May 28
25th
percen-
tile
Median Mean 75th
percen-
tile
Max
(1948)
4740 8690 10600 15300 15900 19700 41400


Discharge, cubic feet per second, [Instantaneous Data Archive]

Most recent instantaneous value: 549 09-30-2010   23:45 PDT
Graph of  Discharge, cubic feet per second, [Instantaneous Data Archive]

Add up to 2 more sites and replot for "Discharge, cubic feet per second, [Instantaneous Data Archive]"

?


Create presentation-quality / stand-alone graph.   Subscribe to WaterAlert      

See this graph on the Monitoring Location Pages


Gage height, feet

Most recent instantaneous value: 7.04 05-28-2024   13:00 PDT
Graph of  Gage height, feet

Add up to 2 more sites and replot for "Gage height, feet"

?


Create presentation-quality / stand-alone graph.   Subscribe to WaterAlert      

See this graph on the Monitoring Location Pages