USGS 13340000 CLEARWATER RIVER AT OROFINO ID

PROVISIONAL DATA SUBJECT TO REVISION

Click to hidestation-specific text
Clearwater River at Orofino, ID - USGS file photo

> Rating Information

> NWS River Forecasts

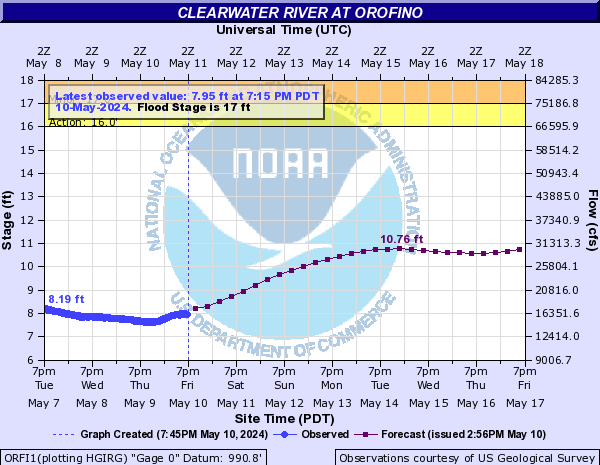
Station is operated in cooperation with the U.S. Army Corps of Engineers .

This station managed by the Post Falls Field Office.

Available Parameters Available Period
  
2014-07-19  2025-05-20
1986-10-01  2010-09-30
1986-10-01  2025-05-20
2007-10-01  2025-05-20


 (7)
 

  -- or --


Summary of all available data for this site
Instantaneous-data availability statement


Temperature, water, degrees Celsius

Most recent instantaneous value: 8.3 05-20-2025   01:15 PDT
Graph of  Temperature, water, degrees Celsius

Add up to 2 more sites and replot for "Temperature, water, degrees Celsius"

?


Create presentation-quality / stand-alone graph.   Subscribe to WaterAlert      

See this graph on the Monitoring Location Pages


Discharge, cubic feet per second

Most recent instantaneous value: 22700 05-20-2025   01:15 PDT
Graph of  Discharge, cubic feet per second

Add up to 2 more sites and replot for "Discharge, cubic feet per second"

?


Create presentation-quality / stand-alone graph.   Subscribe to WaterAlert      

See this graph on the Monitoring Location Pages


Daily discharge, cubic feet per second -- statistics for May 20 based on 68 water years of record more
Min
(1987)
25th
percen-
tile
Most Recent
Instantaneous
Value May 20
Median Mean 75th
percen-
tile
Max
(2008)
12200 22200 22700 30100 32100 40600 70700


Discharge, cubic feet per second, [Instantaneous Data Archive]

Most recent instantaneous value: 1300 09-30-2010   23:45 PDT
Graph of  Discharge, cubic feet per second, [Instantaneous Data Archive]

Add up to 2 more sites and replot for "Discharge, cubic feet per second, [Instantaneous Data Archive]"

?


Create presentation-quality / stand-alone graph.   Subscribe to WaterAlert      

See this graph on the Monitoring Location Pages


Gage height, feet

Most recent instantaneous value: 9.39 05-20-2025   01:15 PDT
Graph of  Gage height, feet

Add up to 2 more sites and replot for "Gage height, feet"

?


Create presentation-quality / stand-alone graph.   Subscribe to WaterAlert      

See this graph on the Monitoring Location Pages